| AP Statistics |
|
|
|
| Sections: 1.| Inference for a Population Proportion 2.| Comparing Two Proportions |
|
|
|
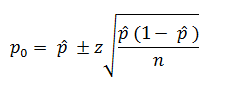
Inference for a Population Proportion The population mean and the sample mean are not the only parameter and statistic used by statisticians. Proportion or percent are often used to describe a situation. Unemployment, the rate of inflation, the strength of a medication, the percent of defects, etc. are examples of situations that use proportions. Similar to the sampling distribution of sample means, the sampling distribution of sample proportions follows the Central Limit Theorem. This distribution is defined as N(po, Plotting sample proportions from the same population will produce a Normal distribution with mean po (mean of the sample proportions will approach the population mean po) and standard error The confidence level for po is found by the formula Confidence
Interval for a Population Proportion
where: po is the population
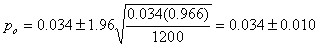
proportion Example: The US Labor Bureau
interviewed 1,200 people. It was found that 41 of those people surveyed
were unemployed. Find a 95% confidence interval for the population
unemployment rate. Substituting into the
formula
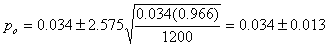
Thus a 95% confidence interval for the population unemployment rate is 0.024 < po< 0.044. Example: Find a 99% confidence
interval for the population unemployment rate using the information from
Example 1. Substituting into the
formula
Thus a 99% confidence interval for the population unemployment rate is 0.021 < po < 0.047. Sample Size Sample Size for the Confidence Interval for the Population Proportion When the estimate
When the
estimate
where: z is the standard score for
the confidence level Example: What is the minimum
number of parts that must be tested to find a 95 % confidence interval for
the population defect rate? Last month's defect rate was 2.1% and the
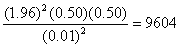
allowable error is + 1%. Thus the company needs to check 782 parts. (Note since you cannot test a fraction of a customer, the sample size is bumped up to the next whole number for any fraction.) Example: What is the minimum
number of parts that must be tested to find a 95 % confidence interval for
the population defect rate? This is a new procedure and thus no sample
proportion exists. The allowable error is + 1%. Thus the company needs to check 9,604 parts.
Hypothesis testing for a single proportion Similar to testing the validity of a claim about a population mean, µ, when σ, the population standard deviation, is known or unknown. Claims made about the population proportion, po, can also be tested for their validity. In this section all problems will involve samples that satisfy the following prerequisites for testing a claim about a proportion.
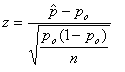
The test statistic "z" is used in this case. The formula for the test statistic is Test Statistic for Proportions
where:
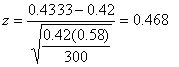
Example: The percent of people who voted to
increase their taxes for the fire protection district was 42% in the last
referendum. A recent survey of 300 residents produced 130 people who would
vote favorably to increase their taxes for the fire department. At a 0.01
level of significance has the proportion of people in favor of the tax
referendum increased since the last referendum? The claim, "the
proportion has increased" translates into po > 0.42.
The corresponding diagram has only one "Reject H0" region, so the 0.01 level of significance is assigned to this region.
Check assumptions: We have to assume the population is 10 times larger than the sample even though is it not stated and it is a SRS. np = (300)(0.4333) = 130 and nq = (300)(0.5666) = 170. Since both are greater than 10 it is safe to use the normal approximation. Similar to calculating a confidence interval for a population proportion, the "z-test" is chosen as the test statistic.
In this problem, the p-value is 0.3199. Starting on the side of the rejection region move into the Normal curve a distance of 0.3199.
Since the p-value did cross the 0.01 line, separating the "Reject H0" region from the "Fail to Reject H0" region, the decision is to "Fail to Reject the Null Hypothesis, H0". Conclusion In conclusion, the Null
Hypothesis, H0, is not rejected and the data appears to
support the claim. The proportion does appear to have remained the
same since the last referendum.
Example: The percent of people who voted to increase their taxes for the fire
protection district was 42% in the last referendum. A recent survey of 300
residents produced 130 people who would vote favorably to increase their
taxes for the fire department. At a 0.01 level of significance has the
proportion of people in favor of the tax referendum remained the same since
the last referendum? Translate the claim,
"the proportion remained the same" translates into p = 0.42.
.
The corresponding diagram has two "Reject H0" regions, so the 0.01 level of significance is divided in half and assigned to each region. (Note that because of symmetry, the size of each rejection region is α / 2.)
Check assumptions: We have to assume the population is 10 times larger than the sample even though is it not stated and it is a SRS. np = (300)(0.4333) = 130 and nq = (300)(0.5666) = 170. Since both are greater than 10 it is safe to use the normal approximation. Similar to calculating a confidence interval for a population proportion, the "z-test" is chosen as the test statistic. Similar to calculating a confidence interval for a population proportion, the "z-test" is chosen as the test statistic.
In this problem, the p-value is 0.6399. Since the Null Hypothesis is H0: po = 0.42 the p value is 0.6399/2 = 0.31995. Starting on either side of the rejection region move into the Normal curve a distance of 0.31995.
Since the p-value did cross the 0.01 line, separating the "Reject H0" region from the "Fail to Reject H0" region, the decision is to "Fail to Reject the Null Hypothesis, H0". Conclusion In conclusion, the Null
Hypothesis, H0, is not rejected and the data appears to
support the claim. The proportion does appear to have remained the
same since the last referendum. Try Self Check 17 Proceed to Multiple Choice 8 Proceed to Statistics Assignment 10: Working with a Single Proportion |
||||||||
|
© 2004 Aventa Learning. All rights reserved. |
 ).
).