| AP Statistics |
|
|
|
| Sections: 1.| Density Curves 2.| Normal Distributions 3.| Normal Distribution Calculations 4| Assessing Normality |
|
|
|
Normal Distribution Calculations The standard normal distribution As the 68–95–99.7 rule suggests, all normal distributions share many common properties. In fact, all normal distributions are the same if we measure in units of size about the mean μ as center. Changing to these units is called standardizing. To standardize a value, subtract the mean of the distribution and then divide by the standard deviation.
STANDARDIZING AND Z-SCORES If x is an observation from a distribution that has mean μ and standard deviation σ, the standardized value of x is
A standardized value is often called a z-score. A z-score tells us how many standard deviations the original observation falls away from the mean, and in which direction. Observations larger than the mean are positive when standardized, and observations smaller than the mean are negative.Example: The values on a blood test are normally distributed with a mean of 60 and a standard deviation of 1.8. What is the standardized z-score for a value of 63 on the blood test? Convert 63 to a standard, z-score.
This means that a value of 63 on the blood test is 1.67 standard deviations above the mean. What about a value of 57?
This means that a value of 63 on the blood test is 1.67 standard deviations below the mean. Try Self Check 10 If the variable we standardize has a normal distribution, standardizing does more than give a common scale. It makes all normal distributions into a single distribution, and this distribution is still normal. Standardizing a variable that has any normal distribution produces a new variable that has the standard normal distribution.
STANDARD NORMAL DISTRIBUTION The standard normal distribution is the normal distribution N(0, 1) with mean 0 and standard deviation 1.If a variable x has any normal distribution N(μ,σ ) with mean μ and standard deviation σ, then the standardized variable
has the standard normal distribution. An area under a density curve is a proportion of the observations in a distribution. Any question about what proportion of observations lie in some range of values can be answered by finding an area under the curve. Because all normal distributions are the same when we standardize, we can find areas under any normal curve from a single table, a table that gives areas under the curve for the standard normal distribution. Standard Normal Distribution
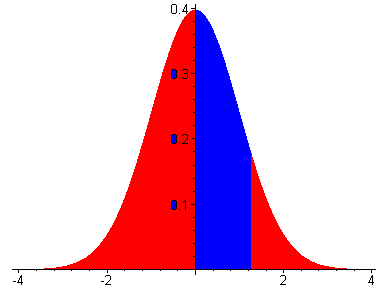
As shown in the illustration below, the values inside the given table represent the areas under the standard normal curve for values below the relative z-score. For example, to determine the area under the curve between the z-scores 0 and 1.23, look in the intersecting cell for the row labeled 1.2 and the column labeled 0.03. The table value is .8907. Since we are not worried about the area below 0 we subtract .500 to obtain .3907. The area between the z-scores of 0 and 1.23 is .3907.
There are other types of z-tables. Some give the area above or below a certain value. Pay attention to the style of the z-table. Many computer programs as well as calculators will calculate z-scores . Try this example: What proportion of observations would lie between the z-scores of -1.69 and 2.74? Answer: Go to the cell that intersects 2.7 and 0.04. The value is 0.9969. Next we need to find the area below -1.69 and subtract it from the value 0.9969. Using the symmetry from the table look up the area that corresponds to the z-score of 1.69. The area is 0.9545. Subtract 0.9545 from to obtain the value below the z-score of 1-.69. (1 - .9545 = .0455). This value, 0.0455, is then subtracted from 0.9969 (0.9969 - 0.0455) to obtain the value 0.9514. The area between the z-scores of -1.69 and 2.74 is 0.9514.
Try
Self Check 11
Finding a value given a proportion The examples above used of the Standard Normal (Z) Table to
find what proportion of the observations satisfies some condition, such as
the proportion between two z-scores. We may instead want to find the
observed value with a given proportion of the observations above or below
it. To do this, use Standard Normal (Z) Table backward. Find the given
proportion in the body of the table, read the corresponding Here is an example: The MAT is a mathematics ability test given to potential graduate students. The distribution of scores is normal. The mean score on the MAT is 84.6 and the standard deviation is 2.0 . Greta received a report stating that she scored at the 92.65 percentile rank. What was her raw score? Step 1. From the z table find the 92.65 percentile. It is more than 50%, therefore it is a positive z-score. Z table has proportions not percentiles, therefore convert 92.65% into proportion by dividing by 100%. X = 92.65%/100% = 0.9265 Search the body of the table until you find 0.9265. The intersection of 1.4 and 0.005 contains the value*. z = 1.45 *Note, the exact value is not always found in the table as in this example. Use a value as close as possible without exceeding the given proportion. Step 2. Transform the z-score into a raw score.
Rearrange the equation and solve for x. x = z(σ) + μ x = (1.45)(2.0) + 84.6 x = 2.9 + 84.6 x = 87.5 Therefore Greta's raw score was 87.5 on the MAT. Try Self Check 12 Proceed to Statistics Assignment 5: Normal Calculations with Drawings
|
||||||||||||||||||||||||||||||||||||||||||||||||||||||||||||||||||||||||||||||||||||||||||||||||||||||||||||||||||||||||||||||||||||||||||||||||||||||||||||||||||||||||||||||||||||||||||||||||||||||||||||||||||||||||||||||||||||||||||||||||||||||||||||||||||||||||||||||||||||||||||||||||||||||||||||||||||||||||||||||||||||||||||||||||||||||||||||||||||||||||||||||||||||||||||||||||||||||||||||||||||||||||
|
© 2004 Aventa Learning. All rights reserved. |