Introduction
In a market economy, price is extremely important. Price serves as a signal to producers. A higher price signals the value of an item to a consumer and gives an incentive to a producer to make a larger quantity of the item.
This lesson will explain the dilemma between the Law of Supply and the Law of Demand. The dilemma is consumers want to buy a larger quantity of a good or service when the price is low, but producers will supply a lower quantity with a low price; suppliers always want to supply a larger quantity of an item when the price rises, but the consumers want to purchase fewer of that item at a higher price.
If you graph the supply and demand curves together it becomes obvious that there is only one price where consumers and producers agree on the quantity of the item needed. This point of agreement is called either the market clearing price or the equilibrium price. Understanding how the market sets a price you will learn how shortages and surpluses are corrected. The unit will also deal with the government's attempt to artificially set prices by creating price floors and price ceilings.
Following successful completion of this lesson, students will be able to...
- Explain the role of price in a market economy.
- Graph and explain shortages and surpluses.
- Predict the changes in price and quantities given changes in demand and/or supply.
- Interpret and compute equilibrium price and quantity from graphs, and/or data.
- Graph and explain consumer surplus and producer surplus.
Essential Questions
- How do we evaluate the combination of supply and demand in the circular flow of the market economy?
Enduring Understandings
- Analyze the role and impact of government in a mixed economy to balance and prioritize a nation’s economic goals.
The above objectives correspond with the Alabama Course of Study: Economics standards: 6.4, 6.5, 6.6, 6.8.
Learn
Equilibrium
Supply and Demand
The problems you will see in relation to supply and demand will require you to start with a product at equilibrium. To do this draw, a supply and demand graph and label the equilibrium price and equilibrium quantity.
Remembering the non-price determinants for both supply and demand (TRIBE and ROTTEN), you will be asked to determine which curve is moving, which direction it is moving, and what happens to the equilibrium price and quantity.
Demand and Supply Together = Market Equilibrium
Demand and Supply Together = Market Equilibrium
Open Demand and Supply Together = Market Equilibrium (3:10) in a new tab
Market Equilibrium
The intersection of the supply and demand curves determines the market equilibrium. At the equilibrium price, the quantity demanded equals the quantity supplied. In market economies, prices are the signals that guide economic decisions and thereby allocate scarce resources.
- For every good in the economy, the price ensures that supply and demand are in balance.
- The equilibrium price then determines how much of the good buyers choose to purchase and how much sellers choose to produce.
- The price is determined when buyers and sellers interact in the marketplace.
- The behavior of buyers and sellers naturally drives markets toward their equilibrium.
- When the market price is above the equilibrium price, there is a surplus of the good, which causes the market price to fall. When the market price is below the equilibrium price, there is a shortage, which causes the market price to rise.
If demand exceeds supply, shortages result. If supply exceeds demand, surpluses result. Market equilibrium results when demand equals supply. The definition of equilibrium is when there are no surpluses or shortages in the marketplace.
Supply-and-Demand Diagram
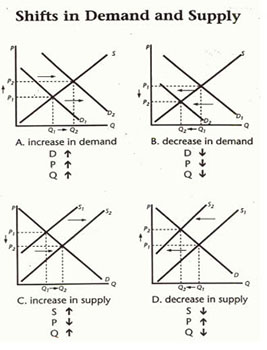
To analyze how any event influences a market, we use the supply-and-demand diagram to examine how the event affects equilibrium price and quantity. To do this we follow four steps:
Step 1
Draw a graph that shows price on the vertical axis and quantity demanded and supplied on the horizontal axis. Draw a giant X. Label your two curves correctly, D and S. Circle the equilibrium point on this graph.
Step 2
Decide whether the event shifts the supply curve or the demand curve (or both). Draw a new curve and circle the new equilibrium point.
Step 3
Compare the new equilibrium with the initial equilibrium by 'reading' your graph. Did price increase or decrease? Did quantity demanded and supplied increase or decrease?
Demonstrating Graphic Equilibrium Video #1
Open Demonstrating Graphing Equilibrium with One Change (3:29) in a new tab
Step 4
Wow! What if BOTH supply and demand curves shifted? This will signal to you that EITHER equilibrium price OR equilibrium quantity will be indeterminate. This means that one of these cannot be determined given that we do not know the extent of the shift in the marketplace.
Demonstrating Graphic Equilibrium Video #2
Open Demonstrating Graphing Equilibrium with Simultaneous Shifts (5:36) in a new tab
Too High or Too Low?
What happens when the market does not have the right price? Sometimes the price of a product can be too high or too low.
- According to the Law of Demand, if the price of a product is too high, consumers will buy less of it. So, there is a surplus of the product.
- To motivate consumers to buy the product, producers will have to lower its price. According to the Law of Demand, as the price of a product decreases, consumers will buy more of it.
- However, according to the Law of Supply, as the price of a product decreases, producers will offer less of it for sale. This lowering of the price will occur until equilibrium is reached.
Market Price Too High or Too Low?
What if the market price for a product is too low?
- Remember, according to the Law of Supply, as the price of a product decreases, producers will offer less of it for sale.
- However, according to the Law of Demand, as the price of a product decreases, consumers will want to buy more of it.
- So, there will be a shortage of the product.
In a shortage situation, stores won't be able to keep it in stock. In order to get the product, consumers will have to bid up its price.
- According to the Law of Demand, as the price of a product increases, consumers will want to buy less of it.
- However, according to the Law of Supply, as the price of a product increases, producers will want to offer more of it for sale.
- This rising of price will continue until the equilibrium price is reached.
A market economy is said to be very efficient because the tendency will be for the market to gravitate towards equilibrium.
Knowledge Check
Reading Graph Practice
Hints:
Watch Demonstrating Graphing Equilibrium with One Shift for help with Graphs A - D.
Watch Demonstrating Graphing Equilibrium with Simultaneous Shifts for help with Graphs E - H.
Open these links now so the videos will be available if you need help!
Remember:
- Left curves shifts = less
- Right curve shifts = more
Knowledge Check #1
Determine what happens to Equilibrium Price when the curve shifts to D2. Locate the new Equilibrium Price by identifying the intersection of the dotted lines.
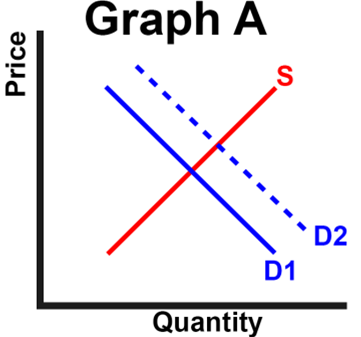
- Increases
- Decreases
- Indeterminate
Answer: a. Increases
Knowledge Check #2
Determine what happens to Equilibrium Quantity when the curve shifts to D2. Locate the new Equilibrium Quantity by identifying the intersection of the dotted lines.
- Increases
- Decreases
- Indeterminate
Answer: a. Increases
Knowledge Check #3
Determine what happens to Equilibrium Price when the curve shifts to D2. Locate the new Equilibrium Price by identifying the intersection of the dotted lines.
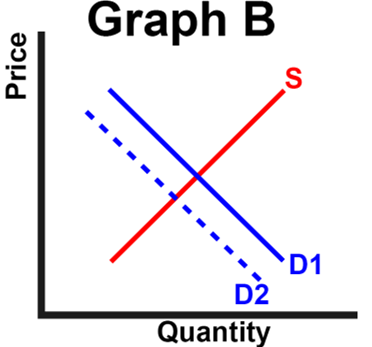
- Increases
- Decreases
- Indeterminate
Answer: b. Decreases
Knowledge Check #4
Determine what happens to Equilibrium Quantity when the curve shifts to D2. Locate the new Equilibrium Quantity by identifying the intersection of the dotted lines.
- Increases
- Decreases
- Indeterminate
Answer: b. Decreases
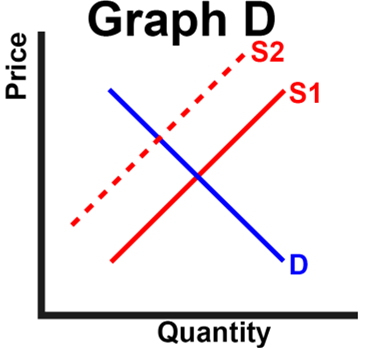
Knowledge Check #5
Determine what happens to Equilibrium Price when the curve shifts to S2. Locate the new Equilibrium Price by identifying the intersection of the dotted lines.
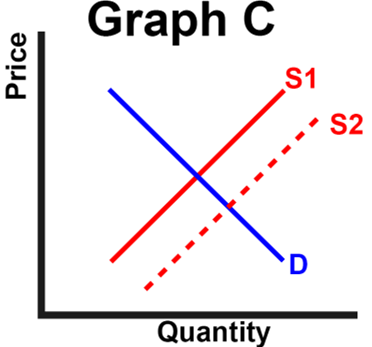
- Increases
- Decreases
- Indeterminate
Answer: b. Decreases
Knowledge Check #6
Determine what happens to Equilibrium Quantity when the curve shifts to S2. Locate the new Equilibrium Quantity by identifying the intersection of the dotted lines.
- Increases
- Decreases
- Indeterminate
Answer: a. Increases
Knowledge Check #7
Determine what happens to Equilibrium Price when the curve shifts to D2. Locate the new Equilibrium Price by identifying the intersection of the dotted lines.
- Increases
- Decreases
- Indeterminate
Answer: a. Increases
Knowledge Check #8
Determine what happens to Equilibrium Quantity when the curve shifts to D2. Locate the new Equilibrium Quantity by identifying the intersection of the dotted lines.
- Increases
- Decreases
- Indeterminate
Answer: b. Decreases
Knowledge Check #9
Determine what happens to Equilibrium Price when the curve shifts to S2 & D2. Locate the new Equilibrium Price by identifying the intersection of the dotted lines.
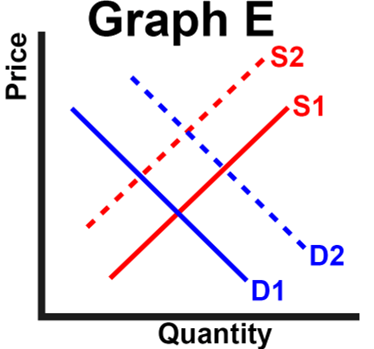
- Increases
- Decreases
- Indeterminate
Answer: a. Increases
Knowledge Check #10
Determine what happens to Equilibrium Quantity when the curve shifts to S2 & D2. Locate the new Equilibrium Quantity by identifying the intersection of the dotted lines.
- Increases
- Decreases
- Indeterminate
Answer: c. Indeterminate
Knowledge Check #11
Determine what happens to Equilibrium Price when the curve shifts to S2 & D2. Locate the new Equilibrium Price by identifying the intersection of the dotted lines.
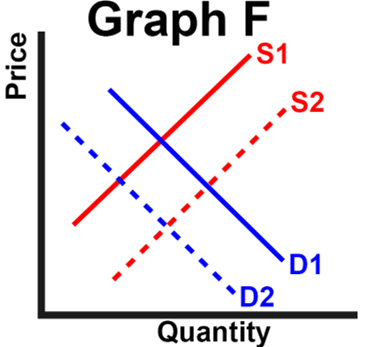
- Increases
- Decreases
- Indeterminate
Answer: b. Decreases
Knowledge Check #12
Determine what happens to Equilibrium Quantity when the curve shifts to S2 & D2. Locate the new Equilibrium Quantity by identifying the intersection of the dotted lines.
- Increases
- Decreases
- Indeterminate
Answer: c. Indeterminate
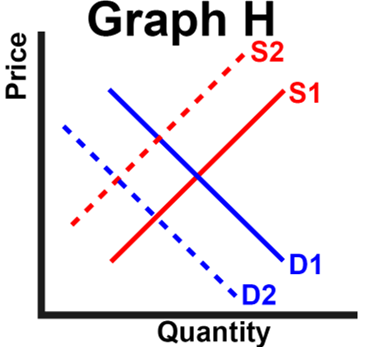
Knowledge Check #13
Determine what happens to Equilibrium Price when the curve shifts to S2 & D2. Locate the new Equilibrium Price by identifying the intersection of the dotted lines.
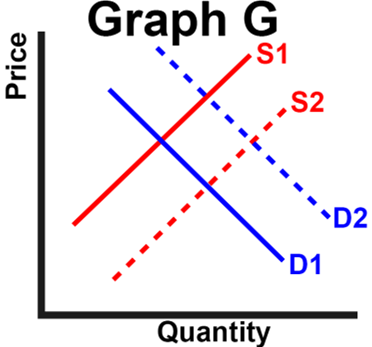
- Increases
- Decreases
- Indeterminate
Answer: c. Indeterminate
Knowledge Check #14
Determine what happens to Equilibrium Quantity when the curve shifts to S2 & D2. Locate the new Equilibrium Quantity by identifying the intersection of the dotted lines.
- Increases
- Decreases
- Indeterminate
Answer: a. Increases
Knowledge Check #15
Determine what happens to Equilibrium Price when the curve shifts to S2 & D2. Locate the new Equilibrium Price by identifying the intersection of the dotted lines.
- Increases
- Decreases
- Indeterminate
Answer: c. Indeterminate
Knowledge Check #16
Determine what happens to Equilibrium Quantity when the curve shifts to S2 & D2. Locate the new Equilibrium Quantity by identifying the intersection of the dotted lines.
- Increases
- Decreases
- Indeterminate
Answer: b. Decreases
Task
Content goes here.