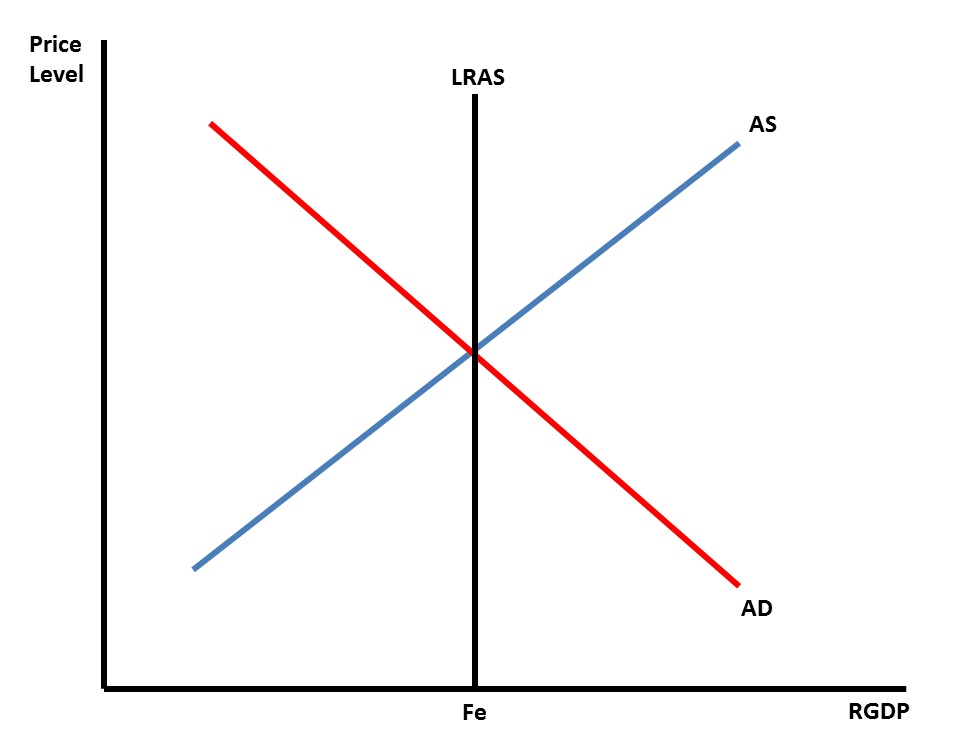
The long-run aggregate supply curve is similar to the traditional supply-demand curve with a few exceptions. While the X axis is still labeled as the price axis, the horizontal Y axis is now labeled the real gross domestic product or RGDP axis. The traditional positively sloped aggregate supply line runs from the lower left to the upper right and the negatively sloped aggregate demand line runs from the upper left down to the lower right. Add to those curves, the long-run aggregate supply line, or LRAS, which runs from the RGDP line vertically through the equilibrium point at the intersection of the AS and AD curves parallel with the vertical price axis. When the economy is at equilibrium, the AS and AD curves settle over the LRAS which intersects the Y axis RGDP line at full employment or FE. It is important to note that, in the long run, changes in price have no impact on the movement of the LRAS curve. In the long run, the output potential of the economy is the same at any point along the price level line. Subsequent illustrations will detail non-price determinants which do cause the short-run AS and AD curves to move to the left the left in the case of recession or to the right to reflect an economy in inflation.
![]()