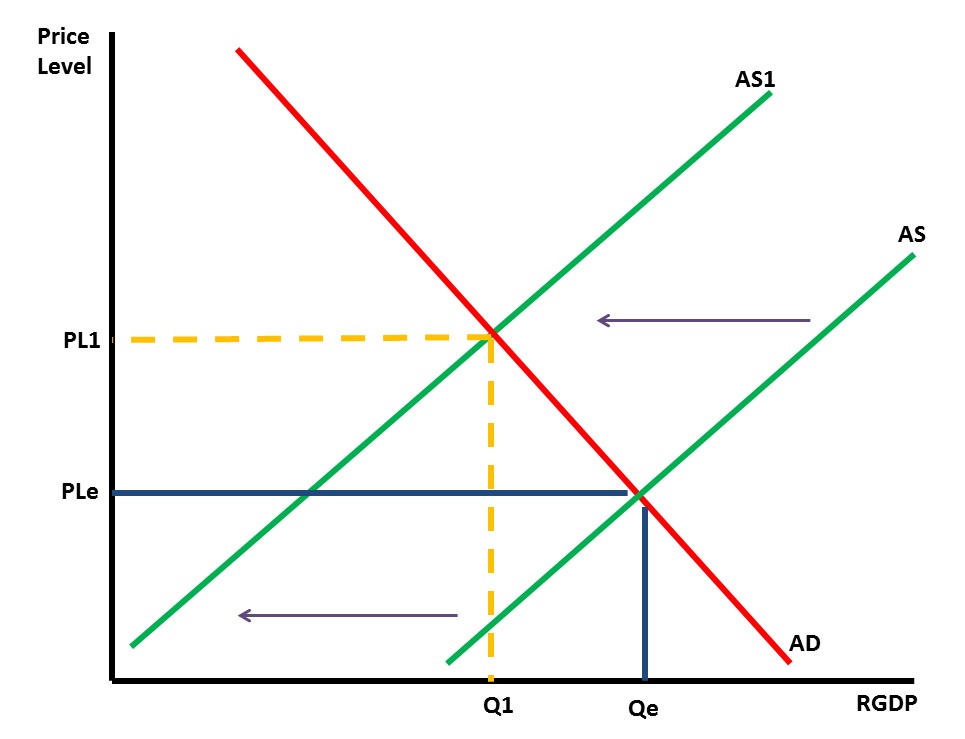
The typical supply and demand graph consists of intersecting supply and demand curves. The equilibrium point is established at that intersection. That point is connected to the vertical price axis and horizontal quantity axis by axis-equilibrium connectors. They mark the price and quantity values represented by the equilibrium point. There are occasions in which the aggregate supply or aggregate demand curves move in response to non-price determinants. If there is an increase in the cost of inputs such as an increase in the minimum wage, for example, the aggregate supply curve will shift to the left indicating a decrease in total supply due to higher production costs. Once the new AS curve has moved to the left, thus establishing a new equilibrium point that is higher on the aggregate demand curve, new price and quantity connector lines must be drawn to connect the new equilibrium point to the vertical price line and the horizontal quantity line. In this case, the price-connector line is drawn from the new equilibrium point to a point that is higher on the vertical price axis. The quantity-connector line is drawn from the new equilibrium point to the horizontal quantity axis farther to the left indicating a lower quantity.
![]()