|
|
|
Module 4 - Game Skills 3 |
|
Objectives: After studying the Module 4 Game Skills 3, you will be able to:
|
|
YOUR LESSON Introduction Are you becoming more comfortable with READ - DATA and PRINT USING? When you need to store many sets of data within a program, READ - DATA is very efficient. When you need to precisely control the output to the screen, PRINT USING is the best solution. In this lesson, we will add one more piece to the puzzle of placing data on the screen...LOCATE. When you need to control the horizontal and vertical position of output on the screen, LOCATE is the only efficient alternative. A statement like LOCATE 7, 12 indicates that printing will begin on the 7th row and in the 12th column. In this assignment, you will continue to focus on READ - DATA and PRINT USING, but we will add a simple use of LOCATE as well. |
 |
|
Several examples that have been used for illustration purposes and several programs that you have written have involved tables of data. Often such tables contain a final row that shows a total of one or more columns. Setting up assignment statements to calculate totals is very easy. The program examples have been written in sections and are often color coded to help you see the program design better. |
|
|
Positioning with LOCATE There are some fairly sophisticated ways of using LOCATE to control the horizontal and vertical position of information on the screen; however, those are beyond the scope of this course. So, we will concentrate on a very simple use of LOCATE...to position a table in the center of the screen without using multiple blank PRINT statements to force the table down the screen. This is easily and simply illustrated with the planets program previously used as an example. A part of the output section of that program is shown below, but this time one LOCATE statement has been added. (Notice that a remark was placed on the same line.) REM
Output This is about the simplest way to use a LOCATE statement. It's not fancy, but it is effective! We could have put in four blank PRINT statements and accomplished the same thing, but using LOCATE is better programming practice. |
|
Calculating Column Totals Tables of data often include totals at the bottom of one or more columns of data. Since you know how to use variables, setting up assignment statements to calculate totals is not difficult. Study the following example carefully. Define the Problem The Programming teachers had a four week bake sale. Mr. Putney's specialty is Chocolate Cake which sells for $8.25 each. Mr. Jordan's specialty is Key Lime Pie which sells for $7.75 each. Mrs. Atwill's specialty is Chocolate Chip Cookies which sells for $6.25 per dozen. Below are the sales results for each week. Putney: 15, 13, 18, 17 We need to calculate how much money was made on the bake sale by each teacher for each week and calculate a total. The results should be printed in the center of the screen with appropriate table headings, column headings, the amount of money taken in each week, and the total for each teacher. The final output is shown below. Color could be added to make it more attractive. |
|
Bake
Sale
|
|||
|---|---|---|---|
|
Mr.
Putney
|
Mr.
Jordan
|
Mrs.
Atwill
|
|
| Week 1 |
$123.75
|
$131.75
|
$143.75
|
| Week 2 |
$107.25
|
$147.25
|
$125.00
|
| Week 3 |
$148.50
|
$100.75
|
$256.25
|
| Week 4 |
$140.25
|
$116.25
|
$100.00
|
| Total |
$519.75
|
$496.00
|
$626.00
|
|
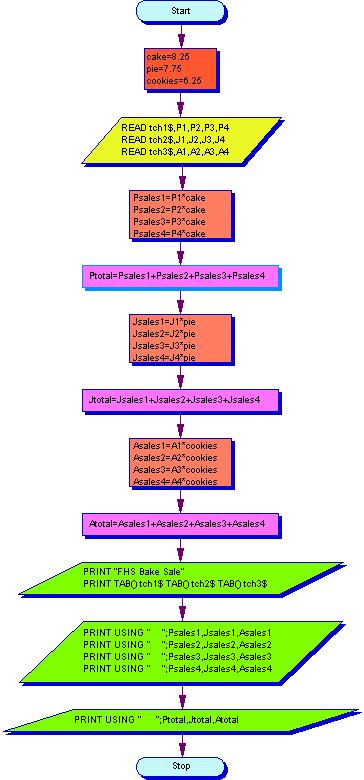
We need to write a program to create this table from the data given. Define the Algorithm The general algorithm for the Bake Sale project is shown below. Examine this flowchart very carefully. Pay very close attention to how the totals for each teacher are calculated. The symbols have been color coded to help you visualize the design of the algorithm. A key is provided to the right of the flowchart. |
|
|
|
Start and Stop indicate the beginning and end of the program. |
| The cost of each item is assigned to a variable. For example, the cost of a cake is $8.25. | |
| The person's name and his/her weekly sales are read into a set of variables for each teacher. For example, Mr. Putney's name is read into tch1$ and his weekly sales numbers are read into P1, P2, P3, and P4. | |
| The weekly sales in dollars is calculated for each teacher. For example, P1 * cake calculates the dollar amount for Mr. Putney for Week 1 and assigns that amount to Psales1. | |
| The total for each teacher is found by adding the sales amount for each week. In the first case, Mr. Putney's total sales is found by adding up the weekly sales (Psales1+Psales2+Psales3+Psales4) and assigning that to the variable Ptotal. | |
| The table heading, column headings, weekly sales amounts, and the column totals are printed out. Notice that the TAB positions and the PRINT USING formats have not been included. These are details that are not needed at this point. In addition, including those details at this stage would make the flowchart symbol really big! | |
| There is really only one thing new about this flowchart--the calculation of totals. In order to calculate the total for each teacher (in the purple rectangles), you must first know the amount sold for each of the four weeks. | |
|
Code the Program The program has already been written so that you can study it carefully.
This program may look a bit intimidating, but it is really simple and straightforward. Believe it or not, there are only two things that are different from what you have seen in any other program up to this point. Let's dissect it to gain a better understanding of what is happening.
REM
Assign Data |
 |
What
does the variable P2 represent in the first READ statement?
|
|
Section
2: Performing the Calculations |
|
Check |
The
following statement represents the total of Mrs. Atwill's sales
for all four weeks.
Atotal = Asales1 + Asales2 + Asales3 + Asales4 |
|
Section 3: Printing the Output in a Table There are several
important things to notice in this section. Section 4: The Data Last but not least are
the DATA statements.
There you have the program dissected. This is a strategy you should use when studying the design of a program. Divide and conquer! |
|
YOUR ASSIGNMENT The program in this assignment is designed to give you more experience in the following areas:
Details of this assignment are provided in the following pdf file which you should print out and carefully study.
Submit your completed assignment "Assignment 04.08" to your instructor for a grade in the Dropbox area. |
|
A QBasic Review Before you move on to the next assignment, please make sure that you can do the following.
Calculating a total is an important concept. Be sure you understand how to do that before moving on. |
|
|
After you have completed this assignment, return to the Game Board and continue with Assignment 4.09 Game Skill 4. |
|
|
|