Learn

Conduction System
The electrical impulses of the heart producing muscular contractions are delivered by the conduction system. This system directs impulses in a specific path as seen in blue on the heart diagram below.
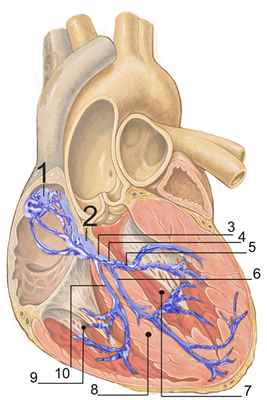
The signal originates from the SA node(#1 in the image) and then travels down to the ventricles. On the diagram:
(1) SA node – signal originates here
(2) AV node
(3 and 4) His bundle (HB) ["His" is pronounced "hiss"]
(6 and 10) Left and Right Bundle branch
(9) Purkinje fibers – signal ends here
View this conduction system animation showing the electrical path and depolarization resulting in an ECG.
View THE HEART Part 2 video on The PBS Learning Network to learn about the conduction system. PBS login information.
Electricity of the Heart
The cardiac cycle does not occur without an electrical stimulus. This electrical stimulus to the heart muscle is achieved through the conduction system.
- When heart cells depolarize process of reversing the charge across a cell membrane , an electrical signal is sent, and a contraction of the heart muscle follows.
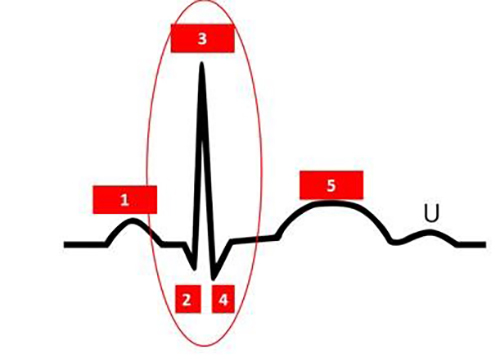
- This depolarization is recorded in the form of waves as seen in the electrocardiogram (ECG or EKG) image. Note the waves in the ECG image labeled "P," "QRS," and "T."
Let's look at how the waves match up to the cardiac cycle.
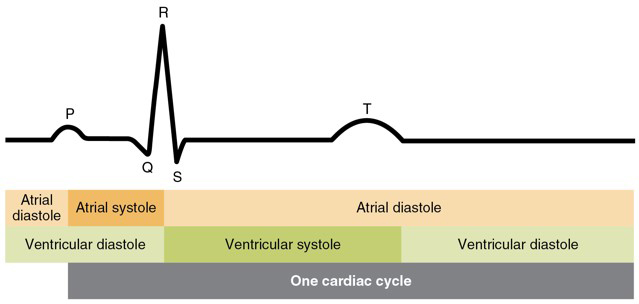
P wave – corresponds with atrial contraction and atrial depolarization
QRS complex – corresponds with ventricular contraction (systole) and ventricular depolarization
T wave - corresponds with end of ventricular contraction (systole) and beginning of ventricular relaxation
Abnormal Electrical Activity
Problems can occur with the conduction system, resulting in health problems. Here are a few examples.
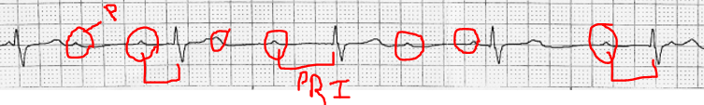
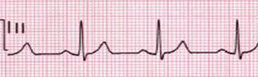
Heart Block – electrical impulses from the SA node are blocked at the AV node.
In the image below, notice the circled P waves do not have a QRS that follows each one as it should.
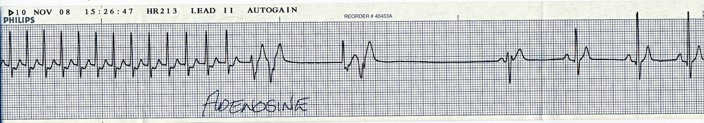
SVT – abnormally fast heart rate at rest.
Notice in the image below how many QRS complexes are seen at the beginning, and then slows down towards the middle after receiving Adenosine medicine.
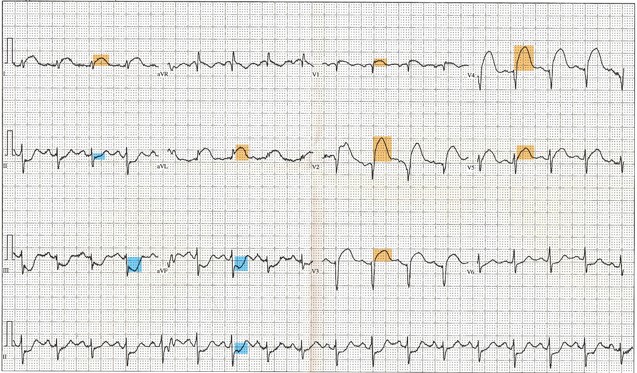
ST Elevation – when the ST segment of the ECG elevates above the baseline ECG. Notice the highlighted sections of ST elevation in the image below. This can occur during a heart attack, and is one way a heart attack is diagnosed.
 Check Your Understanding...
1. What does an ECG record?
2. Identify what is occurring during the QRS complex of this ECG.
3. What number on the diagram below corresponds to the AV node where electrical impulses originate and are sometimes called the "pacemaker of the heart"?
4. If the electrical signal was blocked or slowed down at the AV node (#2 on the diagram above), what would be different on the ECG?
5. What part of this ECG happens when the ventricles begin to depolarize and contract?