Introduction
Equation and Graph
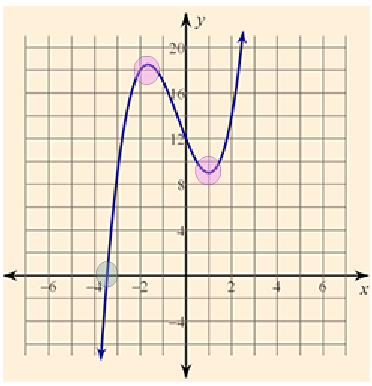
P(x) = x3 − 4x2 − 7x + 10 is graphed here
Notice there are two turning points in the graph. These are called critical points.
Also notice the graph crosses the x-axis three times, so there are three x-intercepts.
Equation and Graph 2
Look at each equation and graph to see the number of turning points and x-intercepts. Is there a connection that you can make between the degree and the turning points and x-intercepts?
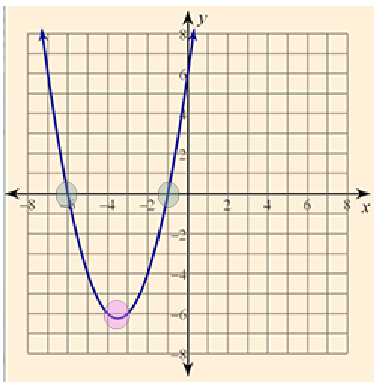
P(x) = x2 + 7x + 6
Number of turning points: 1
Number of x-intercepts: 2
Equation and Graph 3
Look at each equation and graph to see the number of turning points and x-intercepts. Is there a connection that you can make between the degree and the turning points and x-intercepts?
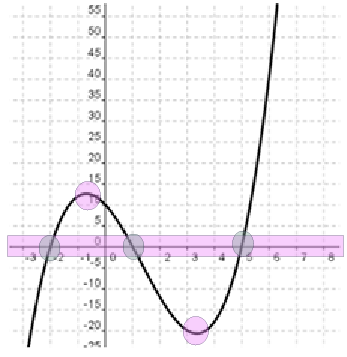
P(x) = x3 + 4x2 + 7x + 10
Number of turning points: 2
Number of x-intercepts: 3
Equation and Graph 4
Look at each equation and graph to see the number of turning points and x-intercepts. Is there a connection that you can make between the degree and the turning points and x-intercepts?
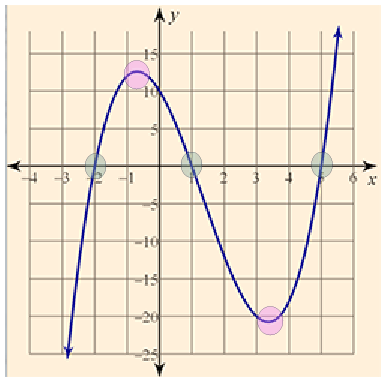
P(x) = x3 + 5x2 + 5x + 12
Number of turning points: 2
Number of x-intercepts: 1
Equation and Graph 5
Look at each equation and graph to see the number of turning points and x-intercepts. Is there a connection that you can make between the degree and the turning points and x-intercepts?
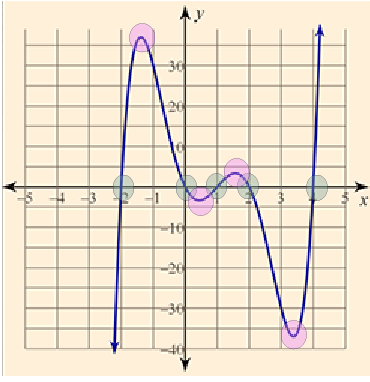
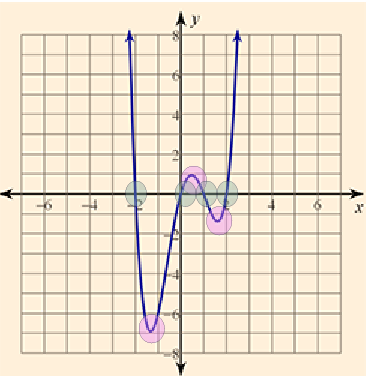
P(x) = 2x4 − 13x3 − 19x2 − 10x + 24
Number of turning points: 3
Number of x-intercepts: 4
Equation and Graph 6
Look at each equation and graph to see the number of turning points and x-intercepts. Is there a connection that you can make between the degree and the turning points and x-intercepts?
P(x) = x5 − 5x4 + 20x2 − 16x
Number of turning points: 4
Number of x-intercepts: 5