Population Pyramid
Before we discuss migration, let's talk about the population from an age-sex structural point of view. Every population or society can be compared by an age-sex structural approach called the population pyramid. Population pyramid is the graphic representation of specified 5-year age groups within a population and by being males or females.
Look at the 2013 U.S. population pyramid.
This pyramid was available from the CIA World Factbook.
Blue represents males and red represents females
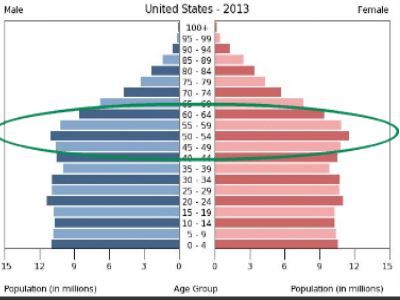
Do you notice anything interesting about the graph? Even though there are slightly more females than males, their relative proportions appear about even. It also shows you the bulge of the baby boomers.
Now, spend some time exploring pyramids from the years 1990, 2000, 2025, and 2050. On these pyramids, the males are in blue and the females are in pink. The pyramids let you watch the disappearance of the baby boomers gradually over the years 1990-2050. By the year 2050, the oldest baby boomer will have to be 104 years old to still be alive. The boungest baby boomer will be 86.
The pyramids show that there will be a similar proportion of males and females. Because birth rates are low and are remaining that way, you see a widening look as the pyramid portrays the population more as a column than a pyramid. Population pyramids can actually take on any number of shapes. But the true pyramid shape comes only when people die soon (narrower pyramid in the older years) and there are high birth rates (a wider pyramid in the younger years).
Look at the three different population pyramids below.
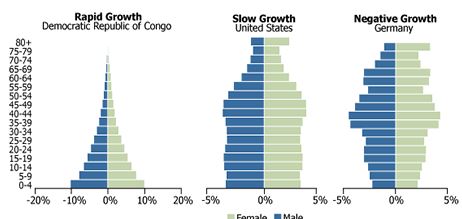
The first, for the Democratic Republic of Congo, an African nation, shows a much truer pyramid shape. This country is expected to grow in population because of the large percentage of the population that is young.
The middle pyramid, the United States, shows a country with relatively slow growth. All population groups are similar in size, until the obvious drops for those who are aging and dying.
The final pyramid, Germany, shows a country where population is expected to decline in coming years. The percentage of young people is actually smaller than those of older people.
All three of these countries do have something in common, however. Each has an overall growing portion of its population who is dependent in some ways on other people in the pyramid. Children are the obvious dependents in the Democratic Republic of the Congo, but the U.S. and Germany have a growing number of elderly people, who are often unable to work and fully support themselves. Having large numbers of dependents in a country can be difficult for the people who are able to work and provide. This is called the dependency ratio.
Dependency ratio is the number of young and elderly people in a population divided by the total adult population. The larger the dependency ratio is, the greater the burden on the average adult because the needs of the dependents must be met by the rest of the adult population.