Death Rates
Death is the termination of the body, its systems, and brain activity in an irreversible way.
U.S. and World death rates from 2009:
| Deaths per | United States | World |
|---|---|---|
| Second | 0.08 | 1.80 |
| Minute | 4.80 | 108.00 |
| Hour | 288.00 | 6,481.00 |
| Day | 6,912.00 | 155,553.00 |
| Year | 2,522,880.00 | 56,777,000.00 |
Think about it: if you can hold your breath for 30 seconds, about 2 people will die in the U.S. and over 54 will die worldwide during that time. Death is a part of life. All of us are at risk of dying, but not all of us share the same risks. To be born around or below the equator, female, tribal, and non-white represents risk factors not shared by those born in the U.S. In fact, in many cases, migrants to the U.S. raise their life expectancies higher than they would have been back in their less developed home countries.
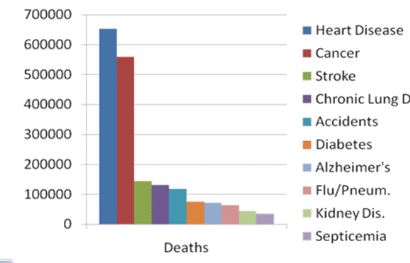
This chart shows the top 10 causes of death in the U.S. Heart disease is and has been the top killer in the U.S. for decades. You might have noticed that the top four causes are highly correlated with tobacco use.
Leading causes of death vary greatly depending on where you live and your income level. Explore the World Health Organization's The Top 10 Causes of Death to see the leading causes of death in 2019 worlwide according to income group.
In less developed nations, there are other significant causes of death that the United States does not have to worry about as much. Causes such as:
- malaria,
- AIDS,
- accidents,
- maternal death,
- diarrhea,
- Measles,
- Mumps,
- Rubella,
- local exotic diseases, and
- other infectious and parasitic diseases.
In fact, AIDS is much more common in Africa and parts of Asia than in any other region of the world. Scientists from a variety of disciplines study and track diseases like AIDS and malaria. Epidemiology is the scientific study of diseases, their transmission, and their management.
The U.S. has the most advanced disease tracking and epidemiological management system at the Center for Disease Control (CDC) in Atlanta, Georgia. You can go to CDC: Travelers' Health, pick a country and read about their current disease concerns and shots you should get in preparation of visiting that country.
Because we have so many visiting and migrating to and from the U.S., it is in the CDC's best interest to be globally concerned and involved. The CDC concerns itself with all diseases in every country. Demographers also concern themselves with a number of death-related rates.
The crude death rate (CDR) is the number of deaths in a given population per 1,000 people living in that population. The infant mortality rate (IMR) is the number of infant deaths per 1,000 live births. The table on the next slide shows these rates in several countries around the world as of 2013.
From the 2008 World Population Data Sheet:
| Country or Region | Crude Death Rate | Infant Mortality Rates TRF |
|---|---|---|
| More developed | 10 | 5.0 |
| Less developed | 7 | 44.0 |
| Africa | 11 | 68.0 |
| Latin America/ Caribbean | 6 | 23.0 |
| Asia (excluding China) | 7 | 40.0 |
| China | 7 | 16.0 |
| Sierra Leone | 18 | 128.0 |
| Canada | 7 | 4.9 |
| Mexico | 4 | 15.0 |
| United States | 8 | 5.9 |
| Italy | 10 | 3.2 |
| Japan | 10 | 2.2 |
| Word | 8 | 40 |
As you can see, the CDR and IMR vary greatly between countries and regions. As of 2013, the nation with the worst Crude Death Rate is Sierra Leone at 18. The best CDR's are found in the Middle East. The United Arab Emirates is at 1 and Kuwait, Oman, and Qatar all are at 2. The U.S. does not have the best CDR or IMR. Some believe that this is a consequence of not having universal medical care.
The best IMR is found in Hong Kong at 1.4, while the nations of Slovenia (1.6), Iceland (1.8) and Singapore (1.8) are not far behind. The nations with the worst IMR are in Africa, with the Central African Republic at 116 and Sierra Leone at 128.
The table reveals some of the variations in death rates for select regions and countries. To summarize these and other findings, you can conclude that: More babies are born in developing nations of the world than in the developed ones. More infants and other people die sooner in the less developed regions of the world than in the developed ones. Most of the world’s future population growth will come from the less developed regions of the world.
Why is the world's population growing so rapidly in regions that have the fewest resources? Part of the answer to this question is found in the demographic transition theory. Demographic transition theory claims that populations go through 3 distinct stages that correspond to the onset of the Industrial Revolution with regard to changes in birth and death rates.
Demongraphic Transition Theory
Demographic Transition Theory Stage #1
The Pre-Industrial Revolution stage encompassed the world's population up until about 1700 AD.
Much of the world's population grew very slowly up to that point. That's all it could do because the high birth rates were offset by the high death rates. Lots of people were born and they died soon.
Stage #2 The Industrial Revolution Stage saw the decline in death rates while birth rates remained high. This is the perfect demographic storm for population growth and this coincides with the rapid growth of populations in Western Civilizations. Lots of people were born and they died later in life.
Stage #3 The Post-Industrial Revolution came with the technical and computer chip revolution that raised the standard of living so much so that death rates remained low while birth rates dropped. Fewer people being born and they die even later in life.
The demographic transition theory does describe what happened in Western Europe, Canada, The United States, Australia, and Japan.
It does not fit so neatly in the less developed countries of the world. Many never really had an Industrial Revolution, but rather benefited from the European one through colonization. Also, they did not move fully into the technological revolution; it just spills over to them gradually.
Because of post World War II medical delivery systems and because of international aid, the less developed countries of the world have had their death rates decline and their lives have been extended.
Their birth rates remain relatively high, which is why so much of the world's future population growth will come from Africa, Latin America, parts of Asia, and the island nations.
Very concerted antinatalistic efforts have been implemented in less developed countries over the last 40 years. Scientists can measure a gradual lowering of the birth rates as a direct result from it. ;
But, keep in mind that however they got there, the peoples of the less developed regions of the world are still in Stage #2 and have explosive population trends that will continue for the next 40-50 years.