Understanding Poverty and Near Poverty
The U.S. uses a set of money income thresholds that vary by family size and composition to determine what it means to be poor or to live in poverty. These threshold measurements create a poverty line. This method has been used in the U.S. since the 1930s with only a few adjustments.
Poverty line is the official measure of those whose incomes are less than three times a lower cost food budget.
According to the 2013 U.S. Census Bureau information, the average weighted poverty line (for a 4 person household was $23,550.)
Relative or Near Poverty is when one earns up to 25% above the poverty line.
Absolute Poverty is the level of poverty where individuals and families cannot sustain food, shelter, warmth, and safety needs.
Absolute poverty is where a family cannot afford the basic necessities of life.
Individuals and families who qualify as living below poverty also qualify for state and federal welfare, which typically includes health care benefits, food assistance, housing and utility assistance, and some cash aid.
Those near poverty may or may not qualify depending upon current state and federal regulations.
The table displays the the U.S. Department of Health and Human Services 2018 poverty guidelines with estimates of near poverty levels.
| Persons in Household/Family | Poverty Guideline (in dollars) |
| 1 | 12,140 |
| 2 | 16,460 |
| 3 | 20,780 |
| 4 | 25,100 |
| 5 | 29,420 |
| 6 | 33,740 |
| 7 | 38,060 |
| 8 | 42,380 |
| For families with more than 8 persons, add $4,320 for each additional person |
The following displays a different view on poverty rates - by racial group.
The thick black line represents the sum of the percent in poverty and near poverty (below 125% of the poverty line) for the years 1980 to 2006. The black line sticks around 25% or about 1 in 4 being in or near poverty in the U.S..
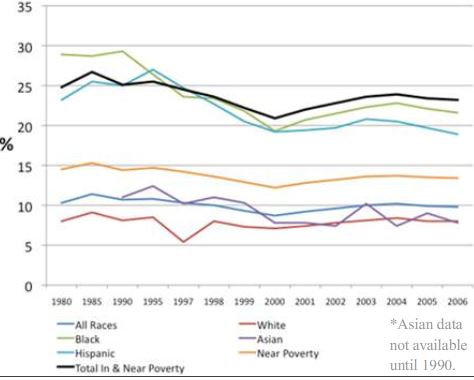
A few takeaways from the table:
Whites (the redline) have the lowest rate of persons in poverty, but they make up the largest number of persons in poverty because they represent about 75% of the total population.
The blue line represents the percent in poverty for all races. It's much lower than the high rates of poverty for Blacks and Hispanics.
Hispanics and blacks have the highest rates of poverty in the U.S..
KFF.ORG: Poverty Rate by Race/Ethnicity
Cenus.gov: Living in Near Poverty in the United States 1966-2012
From this information, you can see that the layers of social stratification have racial factors for both poverty and near poverty levels.
There are differences among economic systems in which people live and have opportunities. This brings up a very important concept from Max Weber. Money, property, medical care and education are all considered to be scarce because of their unequal distribution among social categories. If we think about the valued resources available in the United States, for example, the differences in life chances are readily apparent.
Ultimately, our life chances are intertwined with our social class, race, gender, and age, which will be the focus of our little next unit.
Life Chances are an individual's access to basic opportunities and resources in the marketplace.
Resources are anything valued in a society.
Stratification and poverty exist in the United States very much along lines of race (and age and gender). You will learn in upcoming lessons that life chances and availability of resources are very different for people based on these demographic variables.
It is also important to remember that poverty is different in different parts of the world. What we consider poverty in the United States might not be considered poverty in another country.