Try It
Graphs of Other Trig Functions Practice
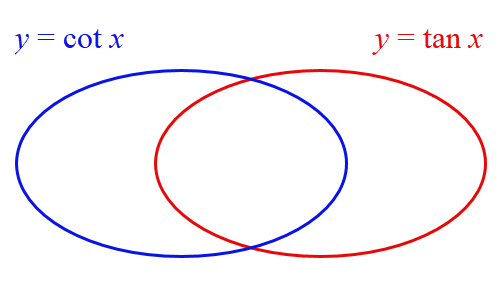
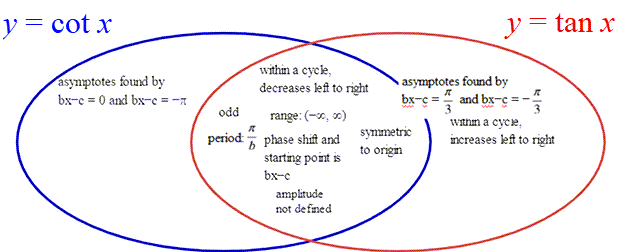
Practice 1: Tangent/Cotangent
Drag each description to its appropriate place on the Venn diagram.
Definitions:
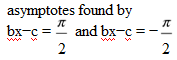
- asymptotes found by bx−c = 0 and bx−c =

- within a cycle, decreases left to right
- range: (−∞, ∞)
- amplitude not defined
- odd
- within a cycle, increases left to right
- phase shift and starting point is bx−c
- symmetric to origin

A. y = a × cot(bx − c)
B. y = a × tan(bx − c)
C. Both y = a × cot(bx − c) AND y = a × cot(bx − c)
A. y = a × cot(bx − c)
B. y = a × tan(bx − c)
C. Both y = a × cot(bx − c) AND y = a × cot(bx − c)
A. y = a × cot(bx − c)
B. y = a × tan(bx − c)
C. Both y = a × cot(bx − c) AND y = a × cot(bx − c)
A. y = a × cot(bx − c)
B. y = a × tan(bx − c)
C. Both y = a × cot(bx − c) AND y = a × cot(bx − c)
A. y = a × cot(bx − c)
B. y = a × tan(bx − c)
C. Both y = a × cot(bx − c) AND y = a × cot(bx − c)
A. y = a × cot(bx − c)
B. y = a × tan(bx − c)
C. Both y = a × cot(bx − c) AND y = a × cot(bx − c)
A. y = a × cot(bx − c)
B. y = a × tan(bx − c)
C. Both y = a × cot(bx − c) AND y = a × cot(bx − c)
A. y = a × cot(bx − c)
B. y = a × tan(bx − c)
C. Both y = a × cot(bx − c) AND y = a × cot(bx − c)
A. y = a × cot(bx − c)
B. y = a × tan(bx − c)
C. Both y = a × cot(bx − c) AND y = a × cot(bx − c)
A. y = a × cot(bx − c)
B. y = a × tan(bx − c)
C. Both y = a × cot(bx − c) AND y = a × cot(bx − c)
Answers:
- A. y = a × cot(bx − c)
- C. Both y = a × cot(bx − c) AND y = a × cot(bx − c)
- C. Both y = a × cot(bx − c) AND y = a × cot(bx − c)
- C. Both y = a × cot(bx − c) AND y = a × cot(bx − c)
- C. Both y = a × cot(bx − c) AND y = a × cot(bx − c)
- B. y = a × tan(bx − c)
- B. y = a × tan(bx − c)
- C. Both y = a × cot(bx − c) AND y = a × cot(bx − c)
- C. Both y = a × cot(bx − c) AND y = a × cot(bx − c)
- C. Both y = a × cot(bx − c) AND y = a × cot(bx − c)
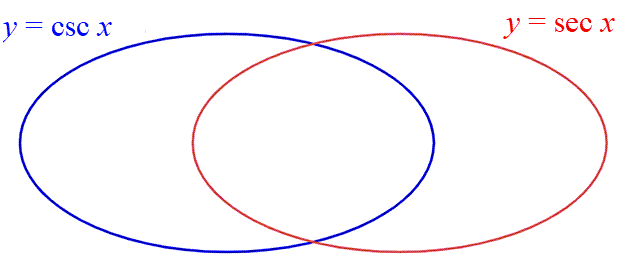
Practice 2: Secant/Cosecant
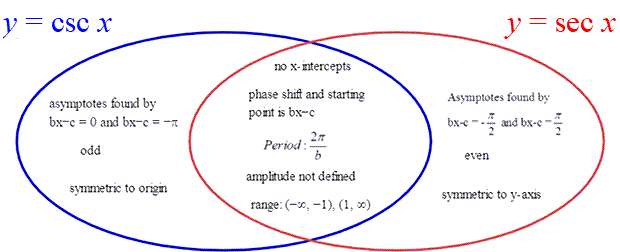
Drag each description to its appropriate place on the Venn diagram.
Definitions:
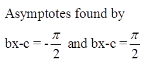
- asymptotes found by bx − c = 0 and bx−c =
- no x−intercepts
- symmetric to origin

- odd
- range: (−∞, −1), (1, ∞)
- even
- phase shift and starting point is bx−c
- amplitude not defined
- symmetric to y−axis
A. y = a × csc(bx − c)
B. y = a × sec(bx − c)
C. Both y = a × csc(bx − c) AND y = a × sec(bx − c)
A. y = a × csc(bx − c)
B. y = a × sec(bx − c)
C. Both y = a × csc(bx − c) AND y = a × sec(bx − c)
A. y = a × csc(bx − c)
B. y = a × sec(bx − c)
C. Both y = a × csc(bx − c) AND y = a × sec(bx − c)
A. y = a × csc(bx − c)
B. y = a × sec(bx − c)
C. Both y = a × csc(bx − c) AND y = a × sec(bx − c)
A. y = a × csc(bx − c)
B. y = a × sec(bx − c)
C. Both y = a × csc(bx − c) AND y = a × sec(bx − c)
A. y = a × csc(bx − c)
B. y = a × sec(bx − c)
C. Both y = a × csc(bx − c) AND y = a × sec(bx − c)
A. y = a × csc(bx − c)
B. y = a × sec(bx − c)
C. Both y = a × csc(bx − c) AND y = a × sec(bx − c)
A. y = a × csc(bx − c)
B. y = a × sec(bx − c)
C. Both y = a × csc(bx − c) AND y = a × sec(bx − c)
A. y = a × csc(bx − c)
B. y = a × sec(bx − c)
C. Both y = a × csc(bx − c) AND y = a × sec(bx − c)
A. y = a × csc(bx − c)
B. y = a × sec(bx − c)
C. Both y = a × csc(bx − c) AND y = a × sec(bx − c)
A. y = a × csc(bx − c)
B. y = a × sec(bx − c)
C. Both y = a × csc(bx − c) AND y = a × sec(bx − c)
Answers:
- A. y = a × csc(bx − c)
- C. Both y = a × csc(bx − c) AND y = a × sec(bx − c)
- A. y = a × csc(bx − c)
- C. Both y = a × csc(bx − c) AND y = a × sec(bx − c)
- B. y = a × sec(bx − c)
- A. y = a × csc(bx − c)
- C. Both y = a × csc(bx − c) AND y = a × sec(bx − c)
- B. y = a × sec(bx − c)
- C. Both y = a × csc(bx − c) AND y = a × sec(bx − c)
- C. Both y = a × csc(bx − c) AND y = a × sec(bx − c)
- B. y = a × sec(bx − c)
Practice 3: Sketching a Graph
Find the following for y = tan(2x −  ), then sketch the graph.
Phase shift: bx − c = 0
- _____ (Fill in the blank) x − = 0
- Answer: 2 x − = 0
- 2x =

- Answer:

- Period: period =

- period =
- Answer:
- Two consecutive vertical asymptotes:
- bx − c = −

- bx − c =
- _____ (Fill in the blank)x − = −
- _____ (Fill in the blank)x − =
- Answer:
- 2x − = −
- 2x − =
- _____ (Fill in the blank)x = − +
- _____ (Fill in the blank)x = +
- Answer:
- 2x = − +
- 2x = +
- x =
- x =

- Answer:
- x =

Draw the graph on the next slide.
Practice 3: Sketching a Graph
On your own paper, using the information below, sketch the graph of
- y = tan(2x − )
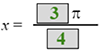
- phase shift: x =
- period =
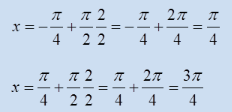
- vertical asymptotes:
 and
and 
- Draw the vertical asymptotes
- Find the x−intercepts, the midpoints between the asymptotes
- Sketch the cycles
- Click Reveal to check your graph
-
- Answer:
-

- You can also check your graph on the calculator.
- Click Mode, then Radian.
- Now click Y= and enter Y1= tan(2x − ) . Then select Zoom 7: ZTrig .