Try It
Logarithmic Curve of Best Fit Practice
Practice 1
Use the table of values to find an exponential model.
| x | y |
| 1 | 3.3 |
| 2 | 6.5 |
| 3 | 8.4 |
| 4 | 9.7 |
| 5 | 10.8 |
| 6 | 11.6 |
| 7 | 12.3 |
| 8 | 13.0 |
| 9 | 13.5 |
| 10 | 14.0 |
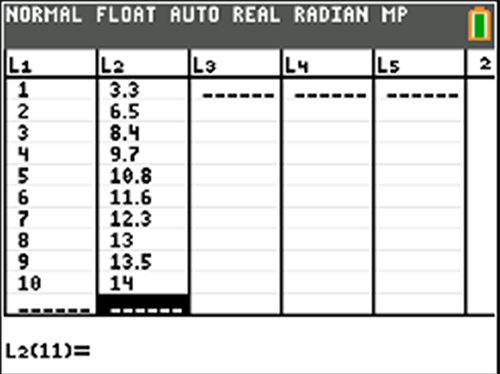
Enter the data into the calculator using the following keystrokes:
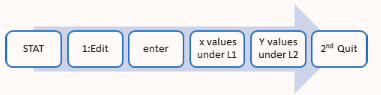
Hitting 2nd Quit saves the data you have entered. Before you hit 2nd Quit, your screen should look like the image to the left.
Practice 1
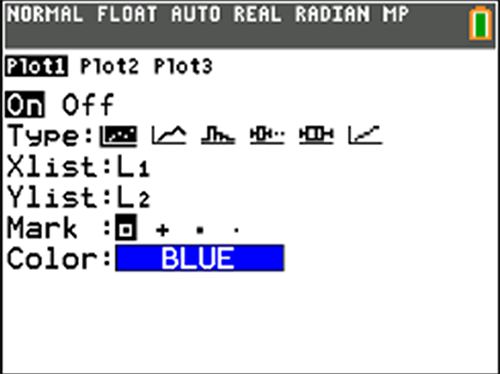
From the blank home screen, follow the calculator keystrokes below.
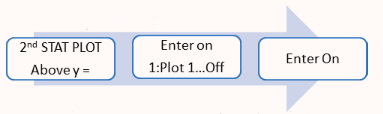
The calculator screen should look like this:
Practice 1
To create the graph:
- Hit the ZOOM key on the top line of the calculator.
- Then use the down arrow key until 9: ZoomStat is highlighted.
- Hit Enter.
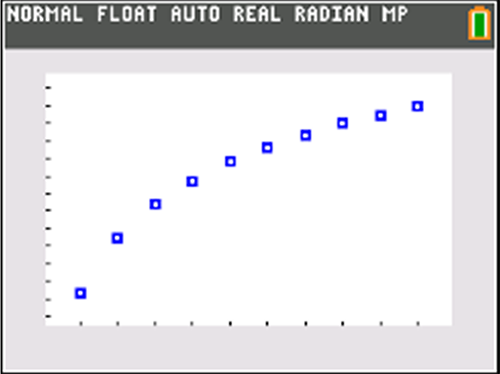
The graph should look like the image above.
Practice 1
To fit a logarithmic model to the data, use the following keystrokes:
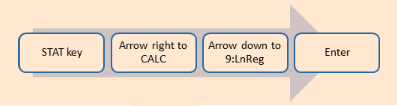
The screen should display the text LnReg. Hit Enter.
Substitute the a and b values into the equation, rounding to 3 decimal places.
y = ____(Fill in the blank) + ____(Fill in the blank) ln x
Answer:
y = 3.286 + 4.650 ln x
Practice 1
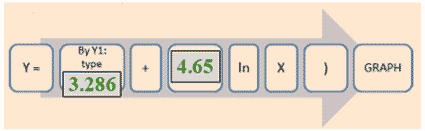
Test the exponential model y = 3.286 + 4.650 ln x using the keystrokes below. For each grey box on the image, enter the correct value from the equation. Click “Reveal” to see the correct values.
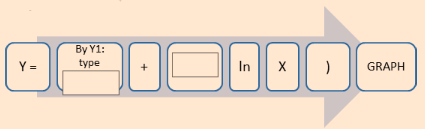
Answer:
Practice 1 Solution
Here is what the graph should look like.
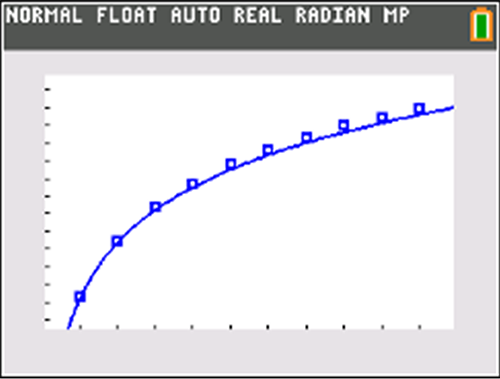
Since the data and the model equation are graphed in the same viewing window, you can see that the model is a good fit.
We conclude that y = 3.286 + 4.650 ln x is a logarithmic equation that models the given data.
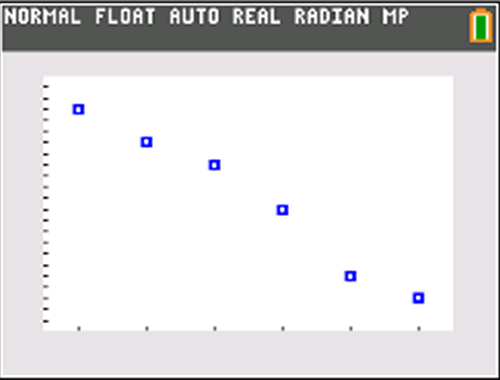
Practice 2
Human Memory Model students in a Precalculus class were given a test and the average score was 88. They were retested for the next 6 months on the same material and the following data was collected.
The x axis represents the month and the y axis the average score.
| x | y |
| 1 | 84 |
| 2 | 81 |
| 3 | 79 |
| 4 | 75 |
| 5 | 69 |
| 6 | 67 |
- Enter the data into the calculator.
- Turn Plot 1 on.
- Graph the data.
Practice 2
Find a logarithmic model. Round values to three decimal places.
- LnReg
- y = a + b ln x
- a = ___(Fill in the blank)
- b = ___(Fill in the blank)
- Substitute the a and b values into the equation, rounding to 3 decimal places
- y = ___(Fill in the blank) + ___(Fill in the blank) ln x
Answer:
- a = 86.282
- b = −9.529
- y = 86.282 − 9.529 ln x
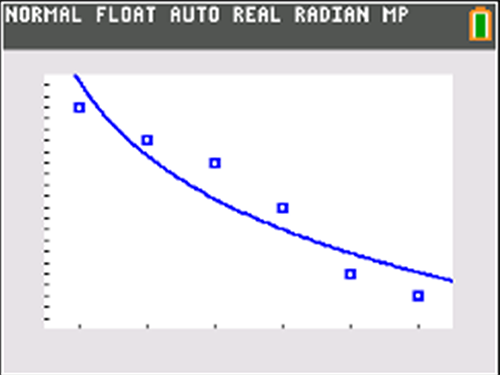
Practice 2 Solution, Part 1
Test the logarithmic model to see if it works.
Since the data and the model equation are graphed in the same viewing window, you can see that the model is a good fit.
We conclude that y = 86.282 − 9.529 ln x is a logarithmic equation that models the given data.
Practice 2 Solution, Part 2
What would you expect the average score to be in the 12th month?
Use the equation y = 86.282 − 9.529 ln x and the keystrokes below.
For each grey box on the image, enter the correct value from the equation. Click “Reveal” to see the correct values.
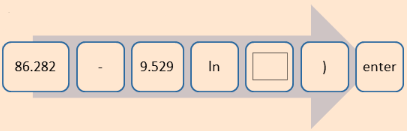
The model predicts the average score to be ____(Fill in the blank) in the 12th month (rounded to the nearest month).
Answer:
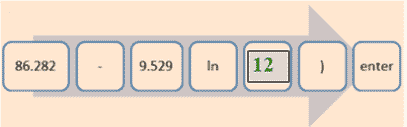
The model predicts the average score to be 63 in the 12th month (rounded to the nearest month).
Practice 2 Solution, Part 3
What would you expect the average score to be in 3 years (36 months)?
Use the equation y = 86.282 − 9.529 ln x and the keystrokes below.
For each grey box on the image, enter the correct value from the equation. Click “Reveal” to see the correct values.
The model predicts the average score to be ____(Fill in the blank)in 3 years (36 months) (rounded to the nearest month).
Answer:
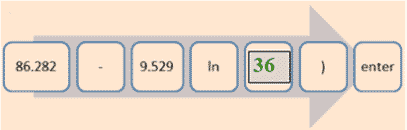
The model predicts the average score to be 52 in 3 years (36 months) (rounded to the nearest month).