Try It
Exponential Curve of Best Fit Practice
Practice Problem #1
Use the table of values to find an exponential model.
| x | y |
|---|---|
| 1.4 | 14.7 |
| 1.8 | 17.1 |
| 2.1 | 18.9 |
| 3.6 | 33.6 |
| 4.5 | 47.5 |
| 6.2 | 89.1 |
| 7.8 | 162.1 |
| 8.3 | 196.3 |
| 8.8 | 235.89 |
| 10.2 | 398.8 |
Enter the data into the calculator using the following keystrokes:
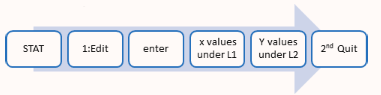
Pressing 2nd Quit saves the data you have entered. Before you press 2nd Quit, your screen should look like the image below.
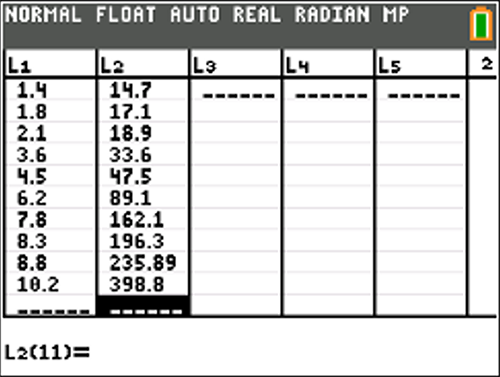
From the blank home screen, follow the calculator keystrokes below.
The calculator screen should look like this:
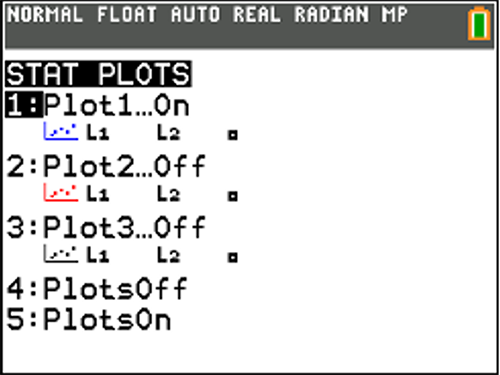
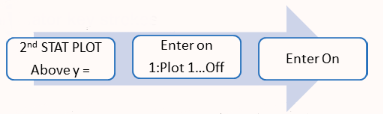
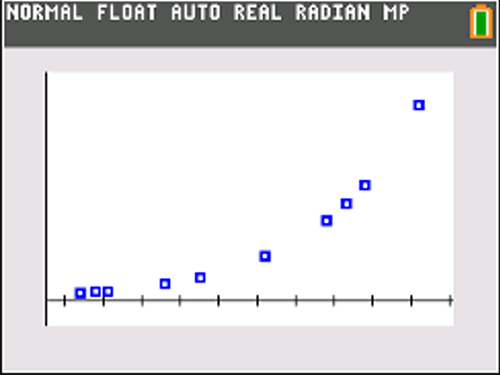
To create the graph:
- Press the ZOOM key on the top line of the calculator.
- Then use the down arrow key until 9:ZoomStat is highlighted.
- Press Enter.
The graph should look like the image below.
To fit an exponential model to the data, use the following keystrokes:
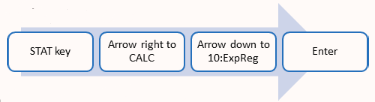
The screen should display the text ExpReg. Press Enter. Substitute the a and b values into the equation, rounding to 3 decimal places.
y = ___ × ___
Answer: y = 8.685 × 1.456x
Test the exponential model y = 8.685 × 1.456x using the keystrokes blow. For each grey box on the image, enter the correct value from the equation.
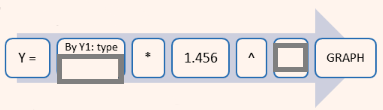
Answer: Y= By Y1: type (8.685) * 1.456 ^ x GRAPH
Practice Problem #1 Soultion
Here is what the graph should look like.
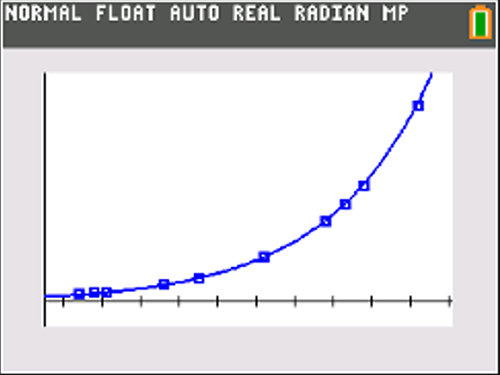
Since the data snd the model equation are graphed in the same viewing window, you can see that the model is a good fit.
We conclude that:
y = 8.685 × 1.456x
is an exponential equation that models the given data.
Practice Problem #2
A new website has just been created. The number of hits for the first 6 months are listed in the table.
- Find an exponential model for the data.
- How many hits would you expect in the 12th month?
- How many hits would you expect in the 15th month?
| x | y |
|---|---|
| 1 | 21 |
| 2 | 37 |
| 3 | 74 |
| 4 | 139 |
| 5 | 267 |
| 6 | 503 |
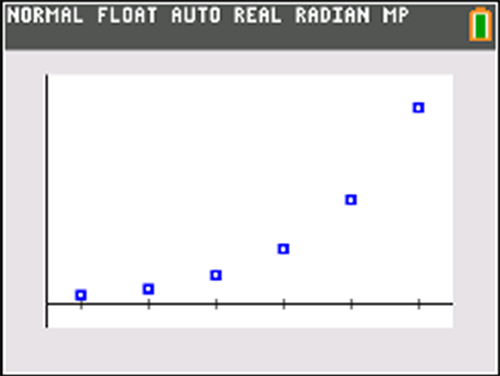
- Enter the data into the calculator.
- Turn Plot 1 on.
- Graph the data.
Find an exponential model.
ExpReg
y = a * b ^ x
a = __
b = __
Answer:
a = 10.7294868
b = 1.898635407
Substitute the a and b values into the equation, rounding to 3 decimal places.
y = ___ × ___
Answer: y = 10.729 × 1.899x
Practice Problem #2 Soultion
- Test the exponential model to see if it works.
Since the data and the model equation are graphed in the same viewing window, you can see that the model is a good fit.
We conclude that:
y = 10.729 × 1.899x
is an exponential equation that models the given data.
- How many hits would you expext in the 12th month?
Use the equation y = 10.729 × 1.899x and the keysrokes below.
For each grey box on the image, enter the correct value from the equation.
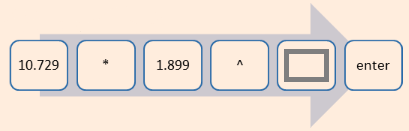
Answer: 10.729 * 1.899 ^ 12
The model predicts ___ hits in the 12th month. (rounded to the nearest hit)
Answer: 23,597
- How many hitswould you expect in the 15th month?
Use the equation y = 10.729 × 1.899x and the keysrokes below.
For each grey box on the image, enter the correct value from the equation.
Answer: 10.729 * 1.899 ^ 15
The model predicts ___ hits in the 15th month. (rounded to the nearest hit)
Answer: 161,597