Learn
Exponential Curve of Best Fit
Using Desmos to Enter and Plot Data to Find the Curve of Best Fit
Open Using Desmos to Enter and Plot Data to Find the Curve of Best Fit in a new window
Note: The presentation may take a moment to load.
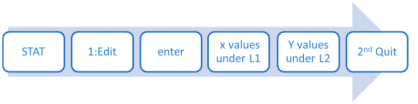
Using the Calculator to Enter and Plot Data
Enter the data from the table into your calculator using the keystrokes below.
Before you hit 2nd Quit, your calculator’s screen should look like the image below.
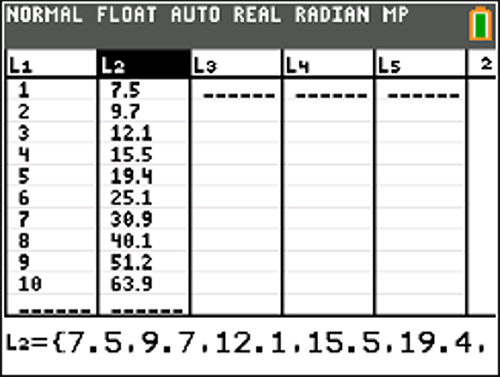
| x | y |
| 1 | 7.5 |
| 2 | 9.7 |
| 3 | 12.1 |
| 4 | 15.5 |
| 5 | 19.4 |
| 6 | 25.1 |
| 7 | 30.9 |
| 8 | 40.1 |
| 9 | 51.2 |
| 10 | 63.9 |
Using the Calculator to Enter and Plot Data
For the second step, use the following keystrokes:
The calculator screen should look like this:
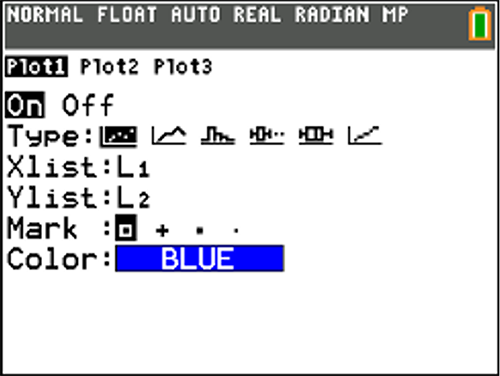
Using the Calculator to Enter and Plot Data
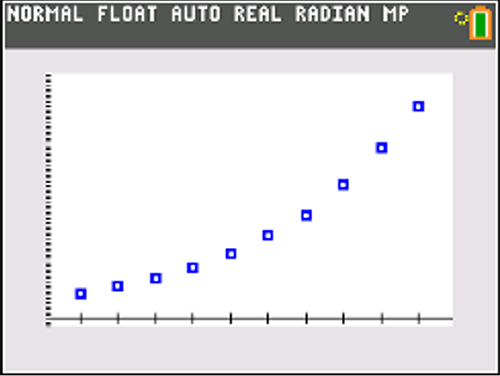
Now, to graph your data, click the ZOOM key on the top line of the calculator keys.
Use the down arrow key until 9: ZoomStat is highlighted, then hit Enter.
The graph should look like this:
Fitting an Exponential Model to Data
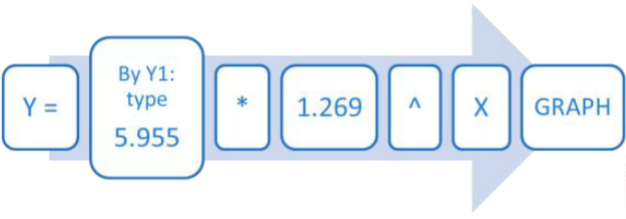
Now use the calculator keystrokes:
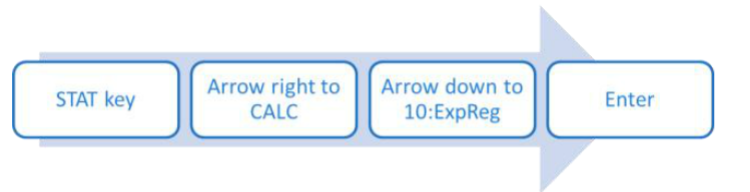
The screen should show the text ExpReg.
Hit Enter.
Now the screen should look like the screenshot to the right.
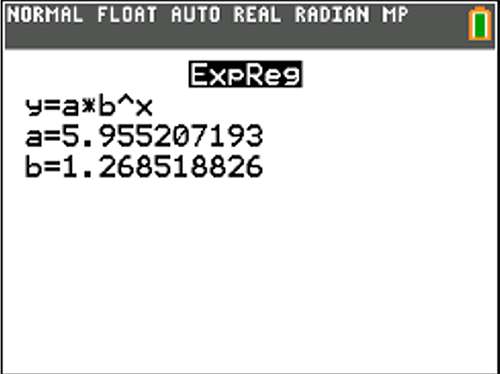
Substitute the a and b values into the equation, rounding to three decimals. y = 5.955*1.269^x
Fitting an Exponential Model to Data
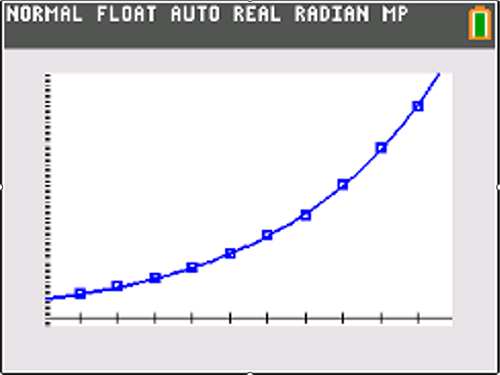
Using the following calculator keystrokes, test the exponential model to see if it works.
The graph should look like the one in the screenshot to the right.
Fitting an Exponential Model to Data
Since the data and the model equation are graphed in the same viewing window, you can see that the model is a good fit for the data.
We can conclude that the equation ![]() is an exponential equation that models the given data.
is an exponential equation that models the given data.
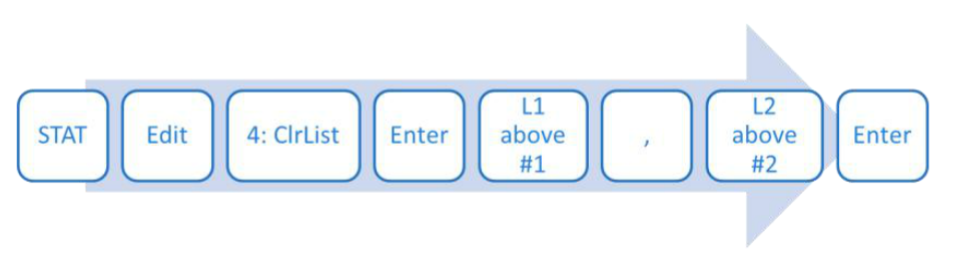
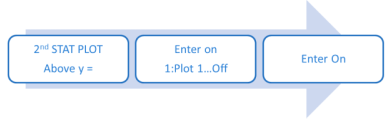
Erasing the STAT Plot
Before you can use the graphing calculator to solve another of these problems, you need to erase the plots. Use the following keystrokes:
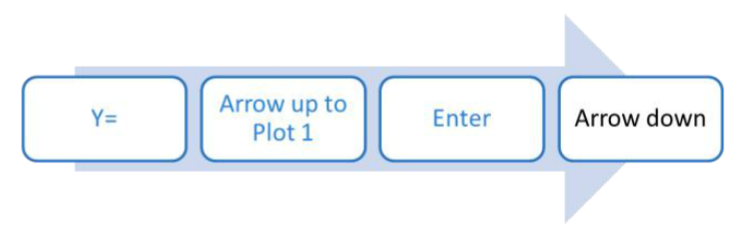
Plot 1 should now no longer be highlighted.
Now to clear the lists for new data, use these keystrokes: