Try It
Graphs of Rational Functions
Domain, Range, and y-intercept
Sketch the graph of the rational function ![]()
Find the domain and range of the rational function.
- Domain: all real numbers except 2x = 0 and x = 0
- Range: all real numbers except y = 2
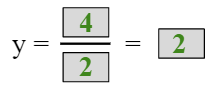
Find and plot the y-intercept by finding f(0).
x-intercept
We continue with the same function, moving on to sketch any x-intercepts.
Sketch the graph of the rational function ![]()
Find and plot the x-intercepts by letting f(x) = 0.
-
=

- = 4x + 8
- = 4x
- = x
- x-intercept: (−2, 0)
Vertical Asymptote
We continue with the same function, moving on to sketch any vertical asymptotes.
Sketch the graph of the rational function ![]()
Find and draw the vertical asymptote(s). Sketch the asymptote(s) on your own paper, then check your answer here.
- = 2x
- = x
Discontinuities and Horizontal Asymptotes
We continue with the same function, moving on to sketch any discontinuities and horizontal asymptotes.
Sketch the graph of the rational function ![]()
Find the discontinuities.
Find and draw the horizontal asymptotes.
- The degree of the numerator equals the degree of the denominator.
Slant Asymptote
We continue with the same function, moving on to sketch any slant asymptotes.
Sketch the graph of the rational function ![]()
Find and draw the slant asymptotes.
Points on the Left
We continue with the same function, moving on to sketch the points on the left of the graph.
Sketch the graph of the rational function ![]()
Find the intervals of increasing and decreasing on the left of the vertical asymptote. Graph each point.
| x | f(x) | |
|---|---|---|
| −1 | ||
| −2 | ||
| −3 |
Points on the Right
We continue with the same function, moving on to sketch the points on the right of the graph.
Sketch the graph of the rational function ![]()
Find the intervals of increasing and decreasing on the left of the vertical asymptote. Graph each point.
| x | f(x) | |
|---|---|---|
| 1 | ||
| 2 | ||
| 3 |
Intervals of Increasing and Decreasing
We continue with the same function, finding the intervals of increasing and decreasing.
Sketch the graph of the rational function ![]()
- Increasing: never
- Decreasing: (−∞, 0) and (0, ∞)
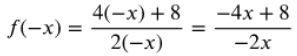
Maximum, Minimum, and Symmetry
Finally, we find the maximum and minimum points, and test for symmetry.
Sketch the graph of the rational function ![]()
- Find the maximum and minimum points.
- Test for symmetry.
There is no symmetry.
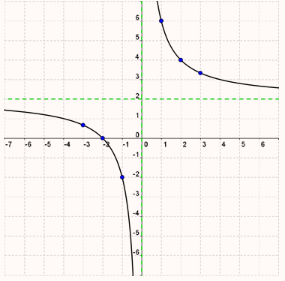
Our final graph of the function ![]() looks like this:
looks like this: