Learn
Curve of Best Fit
Find Quadratic Equation Given Vertex and a Point
Open Find the Standard Form of a Quadratic Equation Given the Vertex and a Point in a new window
Note: The presentation may take a moment to load.
Find Quadratic Equations Given x-Intercepts and a Point
Note: The presentation may take a moment to load.
Find Quadratic Equation Using Quadratic Regression
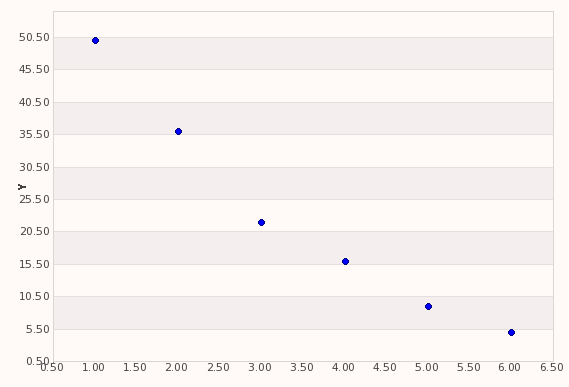
A student dropped a basketball from the top of the bleachers and another student measured the height in inches of each successive bounce. The following data was obtained.
| Bounce | 1 | 2 | 3 | 4 | 5 | 6 |
|---|---|---|---|---|---|---|
| Height | 50 | 36 | 22 | 16 | 9 | 5 |
Insert these lists as L1 and L2 in your calculator or TI-83 simulator. To enter the data, click the STAT button and select 1: Edit.
Next, make a scatterplot of these points by clicking the STAT PLOT button. After you turn on the plot, be sure to select ZOOM, then option 9: ZOOM STAT.
Check your scatterplot against the graph below.
Calculator Instructions:
Use the quadratic regression feature on your calculator to find the quadratic equation for the best fit for the data. To do this,
- Click the STAT key.
- Move over to CALC on the top line.
- Move down to 5: QuadReg.
When you press enter, your screen should display the text "QuadReg."
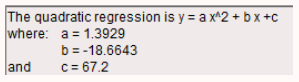
Press enter again. Your screen should display the quadratic equation form and the values of a, b, and c.
The quadratic equation is found by substituting in a, b, and c:
y=1.39x2−18.66x + 67.2
Applet instructions:
- Put the data to plot and analyze in the DATA section
- ANALYZE will find the quadratic function which best approximates the data, plot it, and display its equation in the RESULTS area.
The output will look like this:
The quadratic equation is found by substituting in a, b, and c:
y= 1.39x2 − 18.66x + 67.2
Click Y= on your calculator and type this equation in Y1. Then click GRAPH. (Note: to enter x in the equation, click ALPHA.)
Note: if you don't have a calculator, you can graph the equation by going to geogebra.org and launching Geogebra. To graph the original points, simply enter the ordered pairs in the Input line. Then you can enter the equation in the Input line to graph. You can also watch the video below for instructions on using the Desmos Calculator to work this problem.
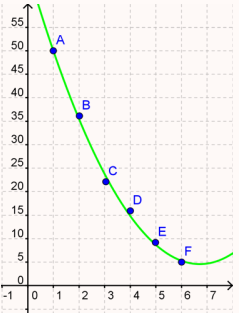
Notice that the quadratic equation goes right through the points.
This means the equation is a good representation of the data.
y= 1.39x2 − 18.66x + 67.2
Using Desmos to Find a Quadratic Equation With Quadratic Regression
Open Using Desmos to Find a Quadratic Equation With Quadratic Regression in a new window
Note: The presentation may take a moment to load.