Introduction
Graphs, tables, and charts are often used in science to create a visual representation of data. In many cases, you may be asked to interpret data or draw conclusions based on a graph or chart.
In this lesson, you will focus on reading and interpreting different kinds of graphs, including line graphs, bar graphs, and circle graphs. We will also discuss how to locate patterns when reading all types of charts and tables.
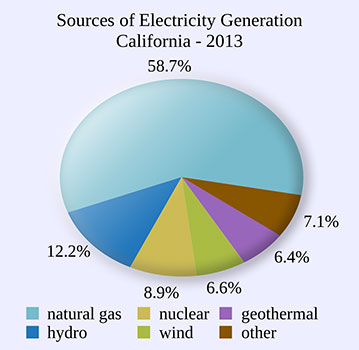
This pie chart shows the sources of electricity produced in California in 2013 and what percentage each source contributed to the total electricity consumed.
| Lesson Objectives |
|
Following successful completion of this lesson, students will be able to...
Enduring Understandings
The above objectives correspond with the Alabama Course of Study: Physical Science standards: 2. |
![]()