Learn
There are several methods for graphing in an online course.
Graphing by Hand
Traditionally, to graph by hand, you need the following materials.
- Graph paper
- Pencil
- Ruler
We will look at how you can graph by hand using a table of values. You should be familiar with a table of values from your previous math courses. See the example table of values below.
| x | y = −2x + 10 | y |
|---|---|---|
| −2 | y = −2(−2) + 10 = 4 + 10 = 14 | 14 |
| −1 | y = −2(−1) + 10 = 2 + 10 = 12 | 12 |
| 0 | y = −2(0) + 10 = 0 + 10 = 10 | 10 |
| 1 | y = −2(1) + 10 = −2 + 10 = 8 | 8 |
| 2 | y = −2(2) + 10 = −4 + 10 = 6 | 6 |
Let's look at the steps for graphing by hand using a table of values.
- Represent the input and output values as ordered pairs.
- How? Pair each input value with its corresponding output value.
- Use a ruler and a pencil to draw and label your horizontal and vertical axes on a sheet of graph paper.
- How? Draw a horizontal line intersecting a vertical line in the middle of the page. Label the horizontal line x and the vertical line y.
- Plot your points.
- How? For each point, start at the origin and move left or right for the first coordinate and up or down for second coordinate.
- Draw a line, curve, and/or segments through the points.
- How? Start at the far left or right point and connect the points. Examine the equation of the function or conic section to visualize the shape of the graph. Knowing the shape of the graph helps you to connect the points with the correct line, curve, and/or segments. Make sure that your represent as much of the graph as possible.
Example
Let’s graph the function: y = 3x − 1
We will provide a table of values.
| x | y = 3x − 1 | y |
|---|---|---|
| −2 | y = 3(−2) − 1 = −6 − 1 = −7 | −7 |
| −1 | y = 3(−1) − 1 = −3 − 1 = −4 | −4 |
| 0 | y = 3(0) − 1 = 0 − 1 = −1 | −1 |
| 1 | y = 3(1) − 1 = 3 − 1 = 2 | 2 |
| 2 | y = 3(2) − 1 = 6 − 1 = 5 | 5 |
Let's work through the steps above.
Step 1: Represent the input and output values as ordered pairs.
How? Pair each input value with its corresponding output value.
What are the ordered pairs?
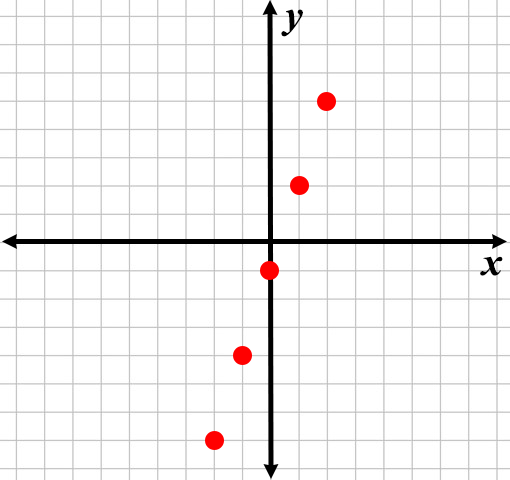
Answer: (−2,7), (−1,−4), (0,−1), (1,2), and (2,5)
Step 2: Use a ruler and a pencil to draw and label your horizontal and vertical axes on a sheet of graph paper.
How? Draw a horizontal line intersecting a vertical line in the middle of the page. Label the horizontal line x and the vertical line y.
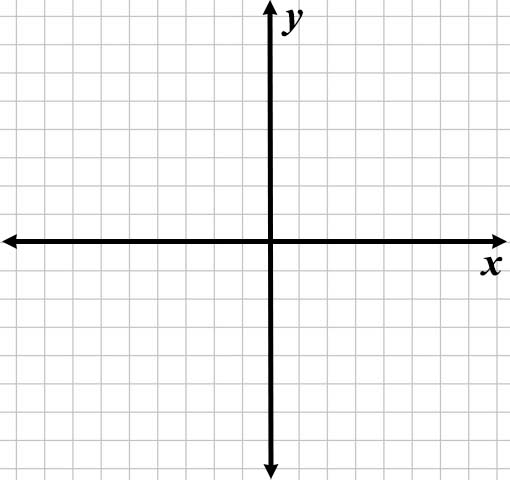
Step 3: Plot your points (−2, −7), (−1, −4), (0, −1), (1, 2), and (2, 5)
How? For each point, start at the origin and move left or right for the first coordinate and up or down for second coordinate.
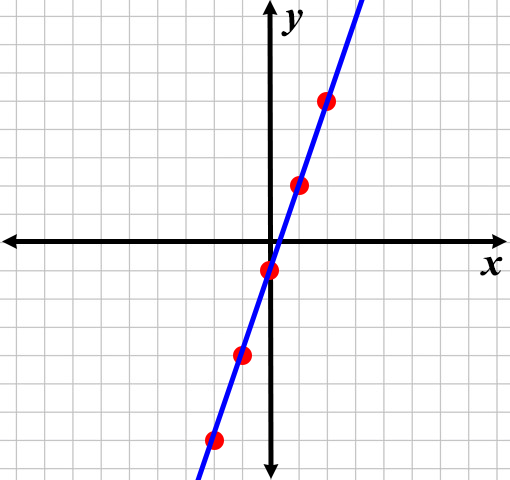
Step 4: Draw a line, curve, and/or segments through the points.
How? Start at the far left or right point and connect the points. Examine the equation of the function to visualize the shape of the graph. Knowing the shape of the graph helps you to connect the points with the correct line, curve, and/or segments. Make sure that you represent as much of the graph as possible.
y = 3x − 1 is a linear equation. Therefore, you will need to draw a straight line through the points.
Videos
For more practice, watch the video below on graphing an absolute value function by hand using a table of values. The teacher will use the steps listed on the previous slides to demonstrate. Please make sure that you practice with the teacher. You will need graph paper, a ruler, and pencil.
Open Graph an Absolute Value Function by Hand in a new tab
For more practice, watch the video below on graphing an exponential function by hand using a table of values. The teacher will use the steps listed on the previous slides to demonstrate. Please make sure that you practice with the teacher. You will need graph paper, a ruler, and pencil.
Open Graph an Exponential Function by Hand in a new tab
Scribble Tool
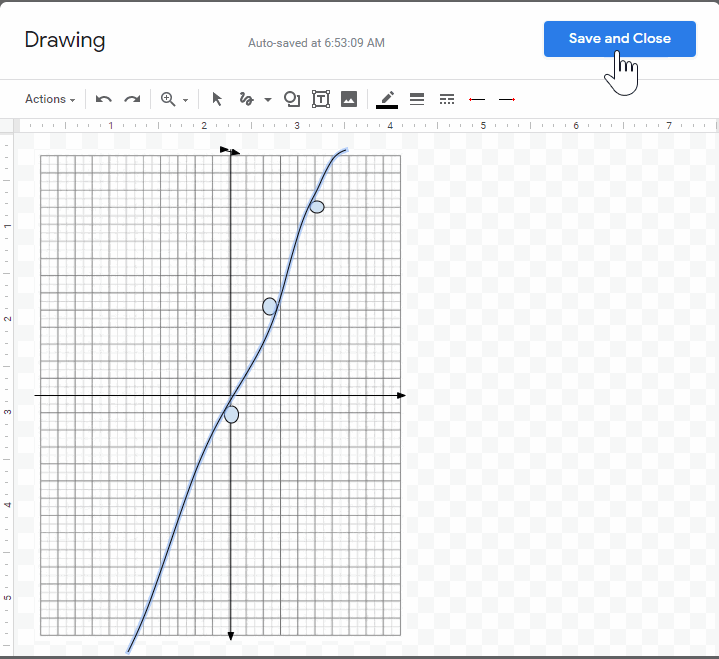
If you don't have graph paper, cannot print your assignment, or do not have a way to make an image of you work, you can still graph by hand directly on your assignment by using the Scribble tool. The Scribble tool allows you to use your mouse like a pencil to draw on a document.
You can find the Scribble tool in Word under Insert >> Shapes.
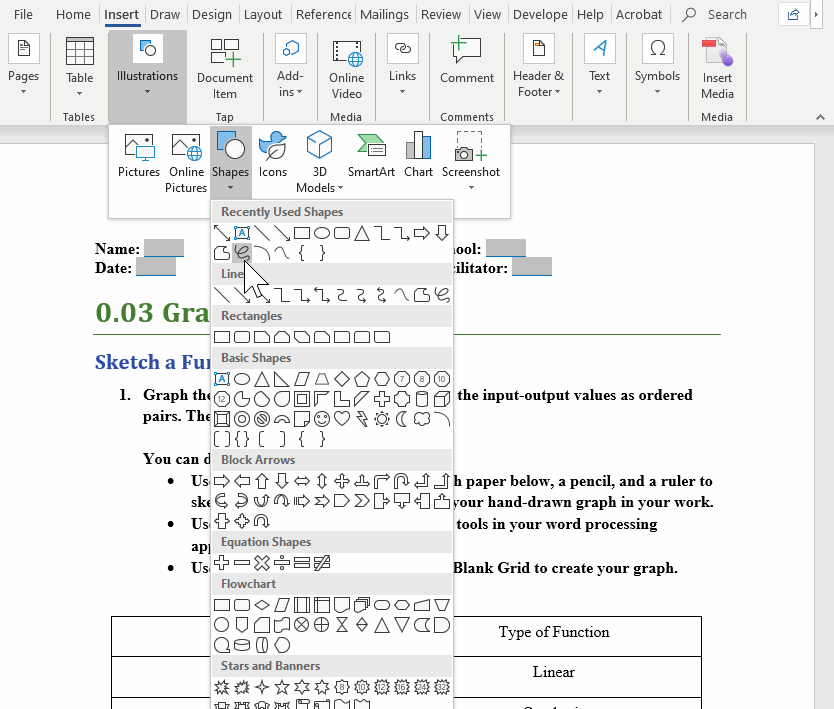
In Google Docs,
1. Open the assignment document.
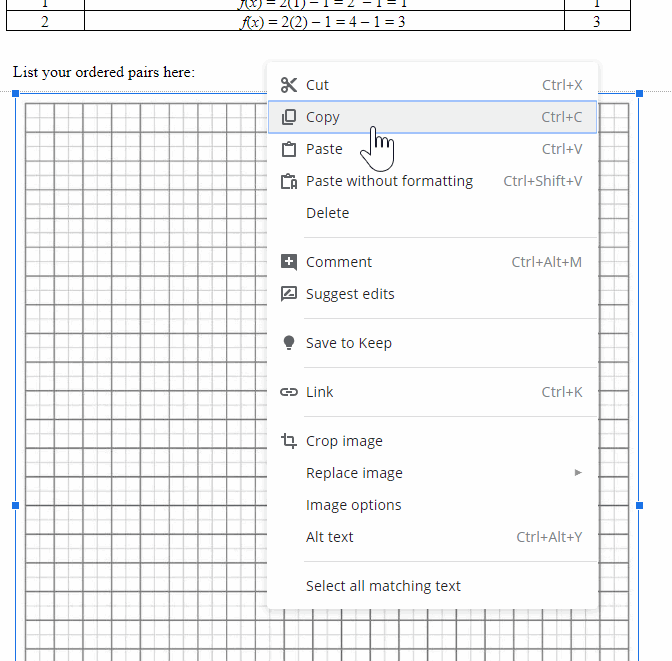
2. Copy the provided graph paper.
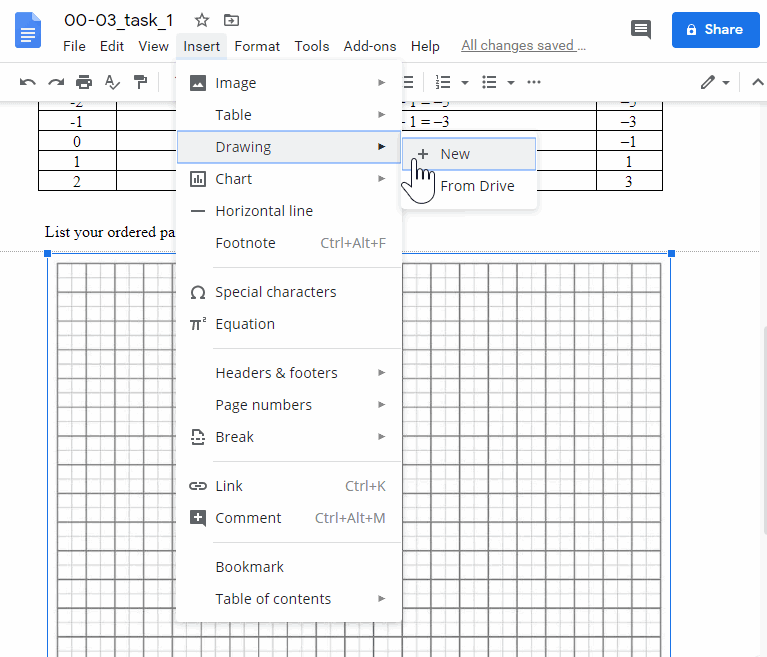
3. Select Insert >> Drawing >> +New.
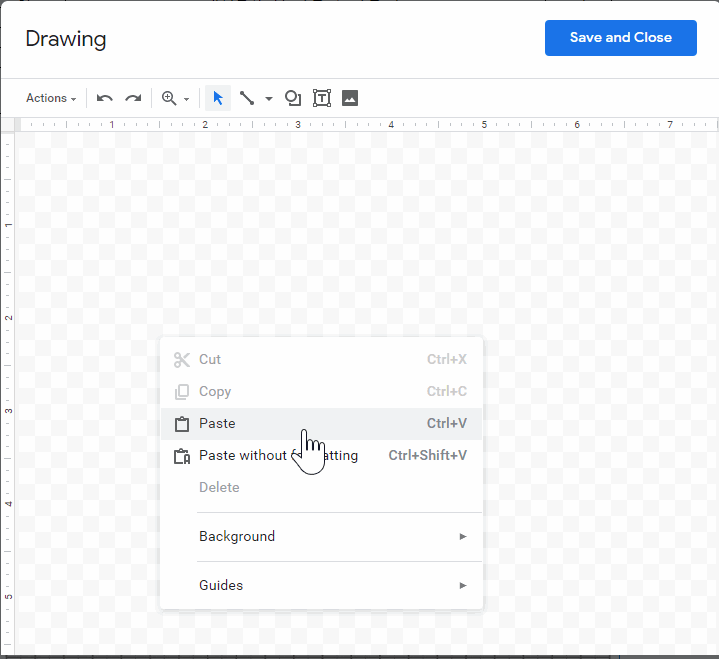
4. Paste the graph paper in the space provided.
5. Use the tools in the Line menu to draw axes, points, and the line.
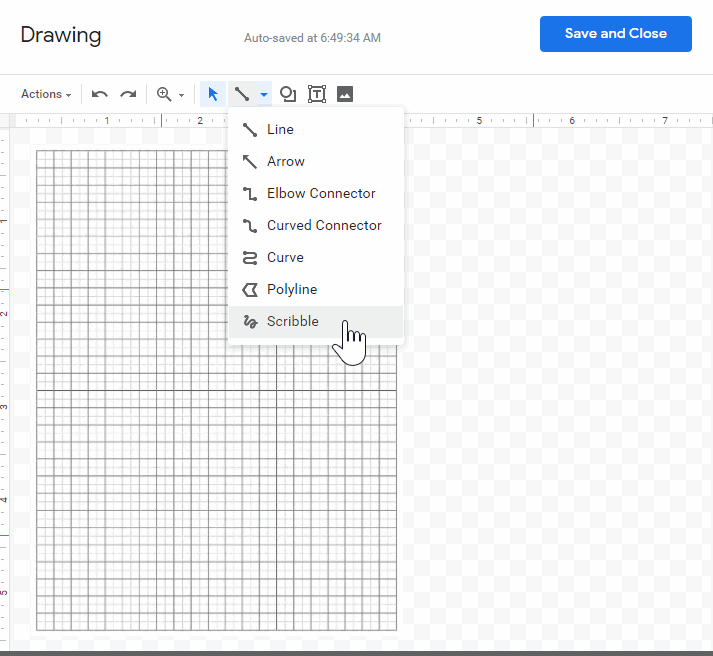
6. When you are done with your graph, select Save and Close.
Graph Functions and Conic Sections Using the ACCESS Manual Graphing – Blank Grid
You can also use the ACCESS Manual Graphing – Blank Grid to manually graph, copy, and paste functions, conic sections, and equations. The blank grid looks like the image below. This grid was created using the Geogebra Graphing Calculator software application. So, if you know how to use Geogebra Graphing Calculator, you will know how to use this grid.
To graph manually, you will use the tools located in the menu.
- The Points Tools button allows you to plot points on the grid.
- The Line Tools button allows you to draw segments, rays, and lines through your points.
- The Circle and Arc Tools button allows you to graph circles and arcs of circles.
- The Conic Section Tools button allows you to graph conics.
Read the Geogebra Tools Manual to learn more about the other tool buttons.
Graph Functions and Conic Sections Using the ACCESS Manual Graphing – Blank Grid
Watch this video to learn how use the ACCESS Manual Graphing – Blank Grid to graph an absolute function given a table of values.
Open Graph an Absolute Value Function Given a Table of Values in a new tab
Watch this video to learn how to graph a linear function using the ACCESS Manual Graphing – Blank Grid.
Open Graph a Linear Function Using the Access Manual Graphing – Blank Grid in a new tab
Watch this video to learn how to copy and paste a graph that created in the ACCESS Manual Graphing – Blank Grid into a task document.
Open Copy and Paste GeoGebra in a new tab
What are some graphing applications that I can use to create graphs?
In your classes, you will sometimes be asked to graph using technology. GeoGebra and Desmos are two web-based applications that you can use to graph. Graphing software applications are great tools for visualizing how changing numbers and variables in equations influences graphs. We are going to practice graphing using both GeoGebra and Desmos Graphing Calculators.
Explore the GeoGebra Graphing Calculator and the Desmos Graphing Calculator.
Click on the following links below to learn how to use the GeoGebra Graphing Calculator. These tutorials will show you how to use the features of the Algebra, Tools, Table, and Graphic Views of GeoGebra.
Geogebra Graphing Calculator
You can graph equations using the input bar on the left or the virtual keyboard under the coordinate plane.
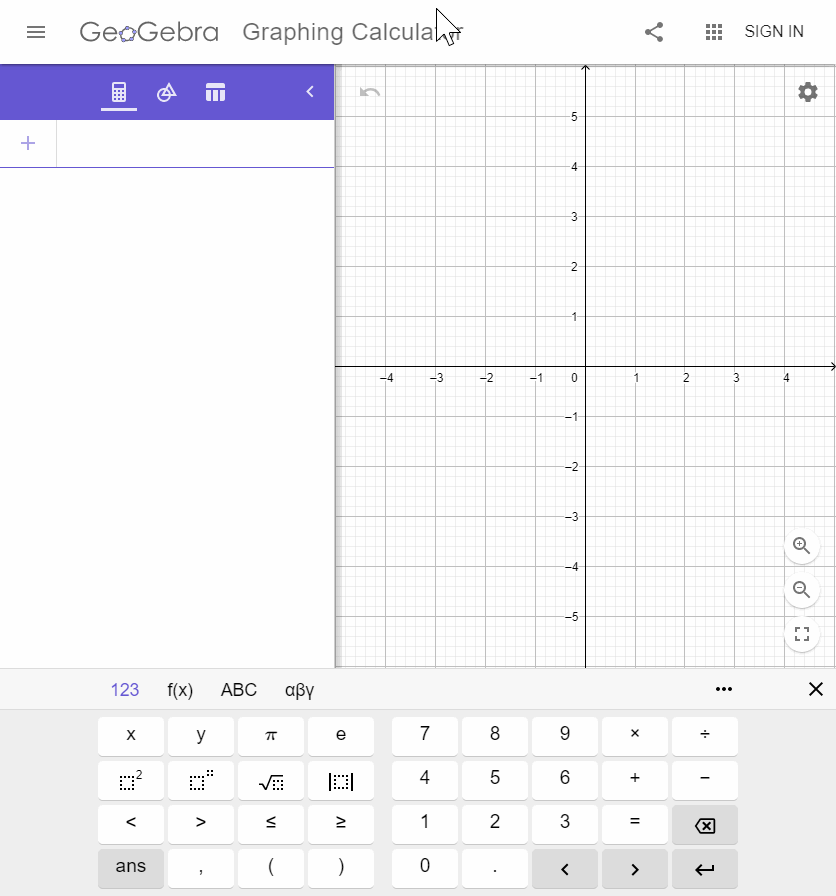
Watch the following videos on graphing a function using GeoGebra Graphing Calculator. In each video, the teacher will use the GeoGebra Graphing Calculator software to graph the function.
Open Graph Using GeoGebra Graphing Calculator Example #1 in a new tab
Open Graph Using GeoGebra Graphing Calculator Example #2 in a new tab
Open Graph Using GeoGebra Graphing Calculator Example #3 in a new tab
How do I use Desmos Graphing Calculator?
These tutorials will show you how to plot points, graph functions, and make tables using Desmos Graphing Calculator.
Watch the following videos on graphing a function using Desmos Graphing Calculator. In each video, the teacher will use the Desmos Graphing Calculator software to graph a given equation.
Open Graph Using Desmos Graphing Calculator Example #1 in a new tab
Open Graph Using Desmos Graphing Calculator Example #2 in a new tab
Copy and Paste an Image of a Graph Using Desmos or GeoGebra Graphing Calculator
Do you know how to copy and paste an image onto a document? What do you do when there are instructions on your assignment to copy and paste an image of the graph of a function, conic section, or equation using the Desmos or GeoGebra Graphing Calculator? Coping and pasting an image onto a document can be just as easy as using these three keys on your keyboard: Control, C, and V.
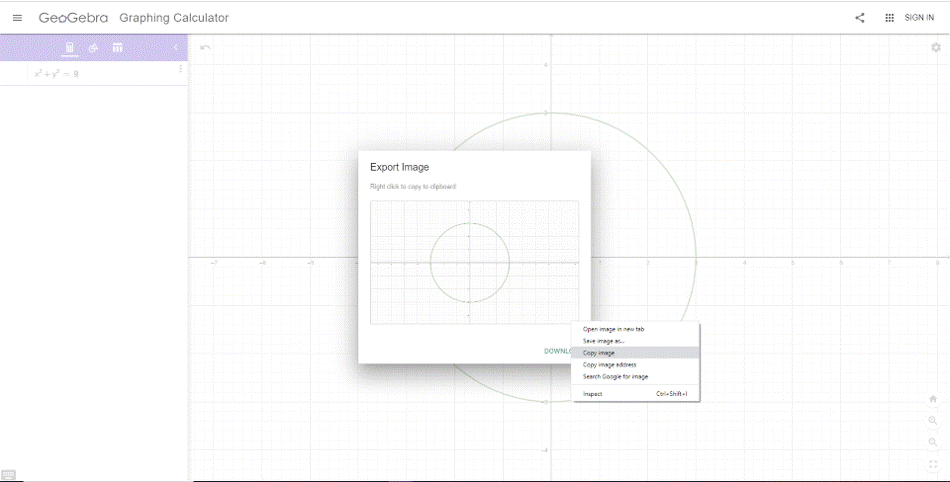
It’s just as simple with GeoGebra and Desmos. We will use the Export Image tool (button) to copy and paste images of graphs of functions created in both the GeoGebra and Desmos Graphing Calculator software applications. Let’s learn how to copy and paste the image of a GeoGebra Graph first.
- When you are ready to copy and paste your graph, click the Main Menu tab.
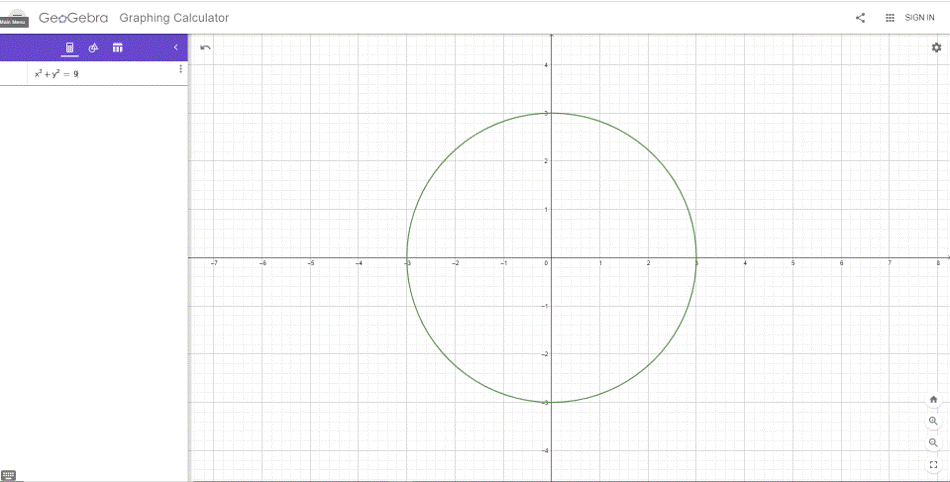
Click on the image to view a larger version. - Click Export Image.
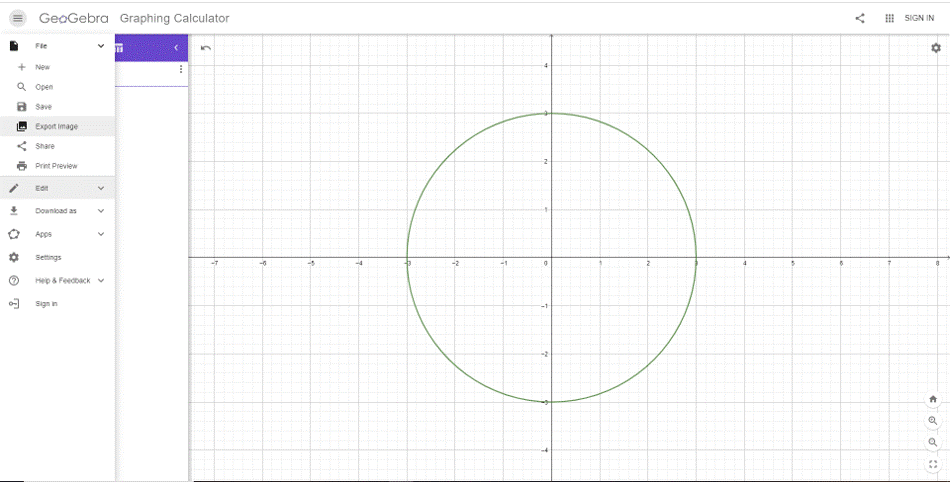
Click on the image to view a larger version. - Right-click on the image and select Copy image. Or, click the download link to download and save a copy of the image.
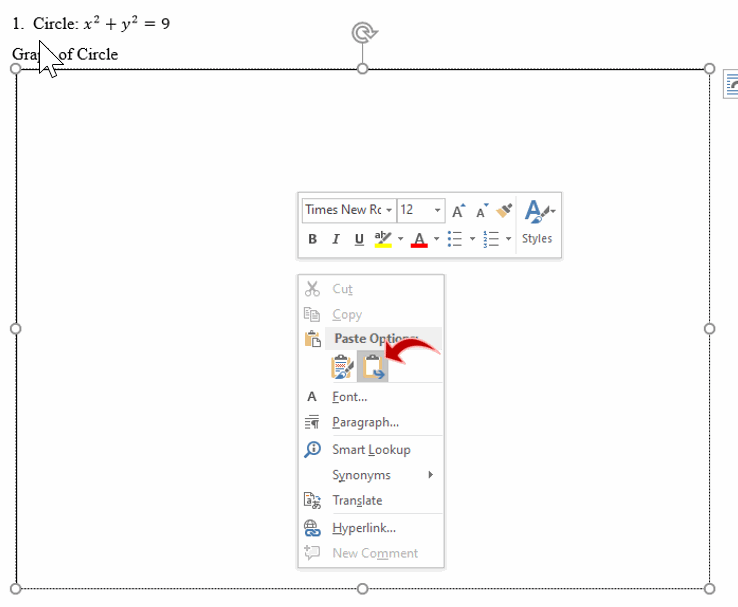
Click on the image to view a larger version. - Go to your assignment document. Right-click in the area where you want to paste the image and select Paste.
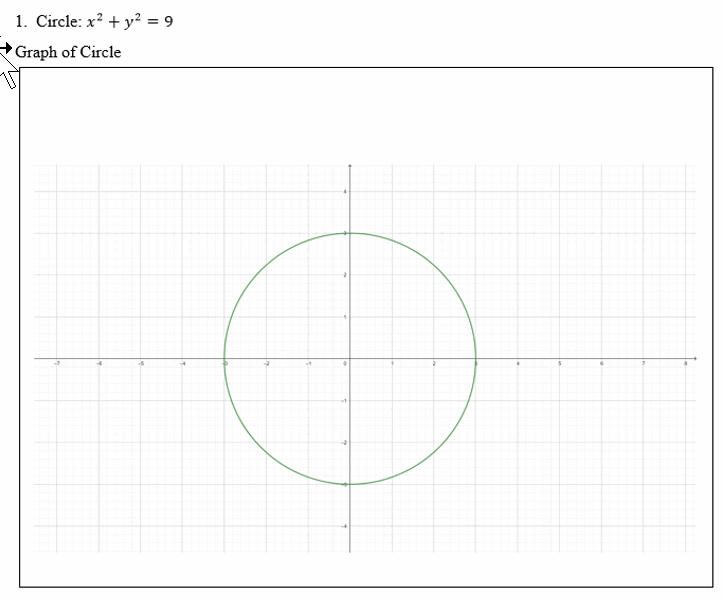
Click on the image to view a larger version. - Make sure that the image fits in the provided space or box. Resize the image if needed.
Click on the image to view a larger version.
How to Copy and Paste a Desmos Graph
Now, let's learn how copy and paste a Desmos Graph.
- When you are ready to copy and paste your graph, click the Share Graph button in the far right corner of the screen.
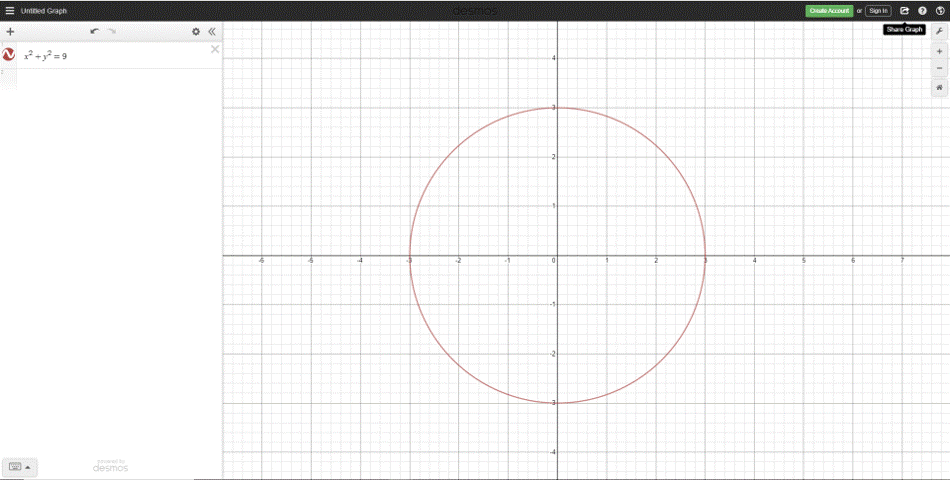
Click on the image to view a larger version. - Click Export Image.
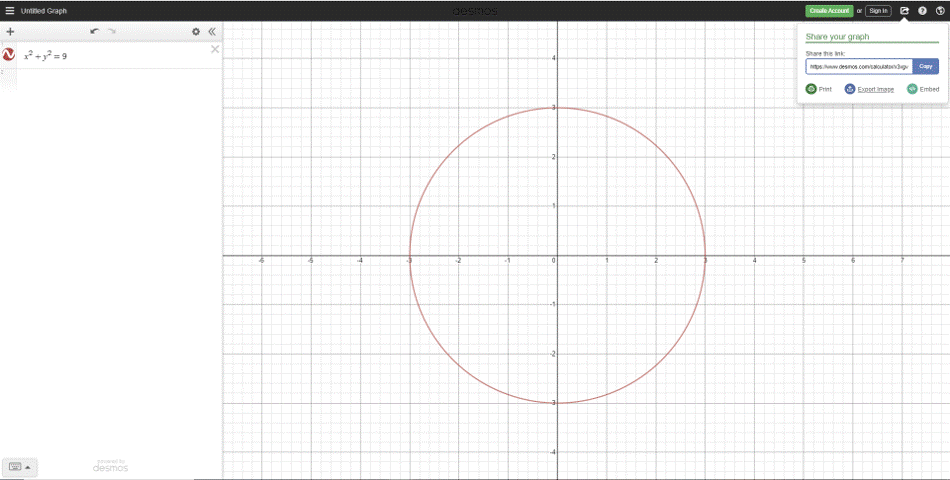
Click on the image to view a larger version. - Select Large Square from the Size dropdown menu.
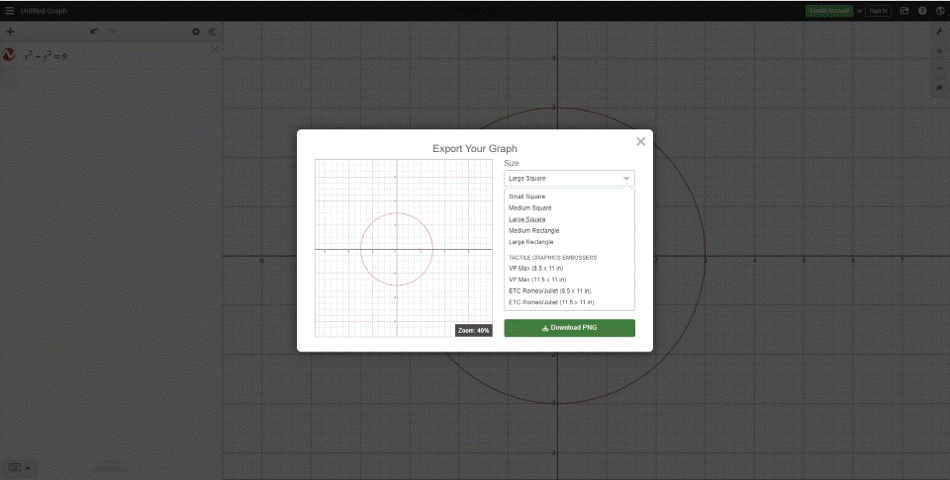
Click on the image to view a larger version. - Right-click on the image and select Copy image.
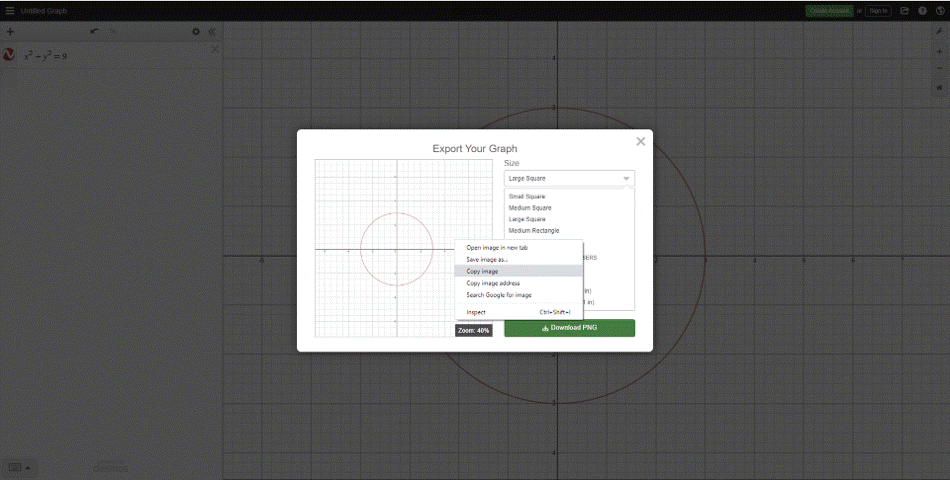
Click on the image to view a larger version. - Right-click in the area where you want to paste the image and select paste.
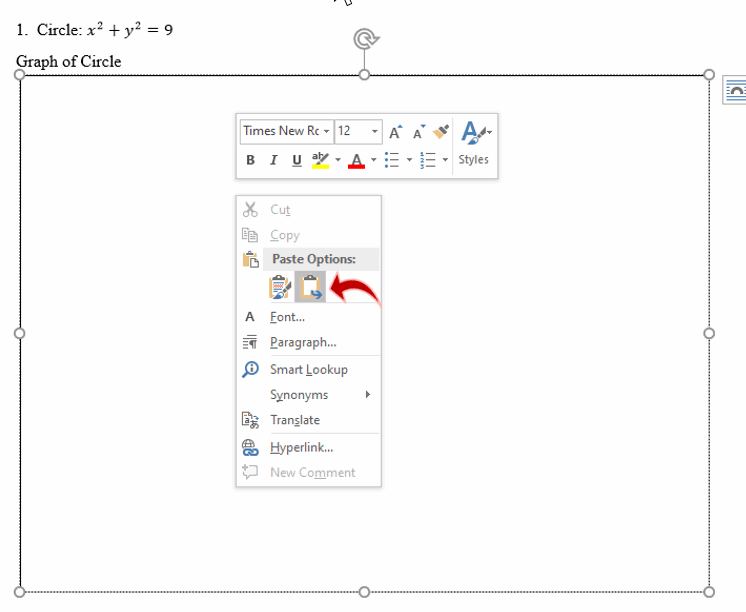
Click on the image to view a larger version. - Make sure that the image fits in the provided space or box. Resize the image if needed.
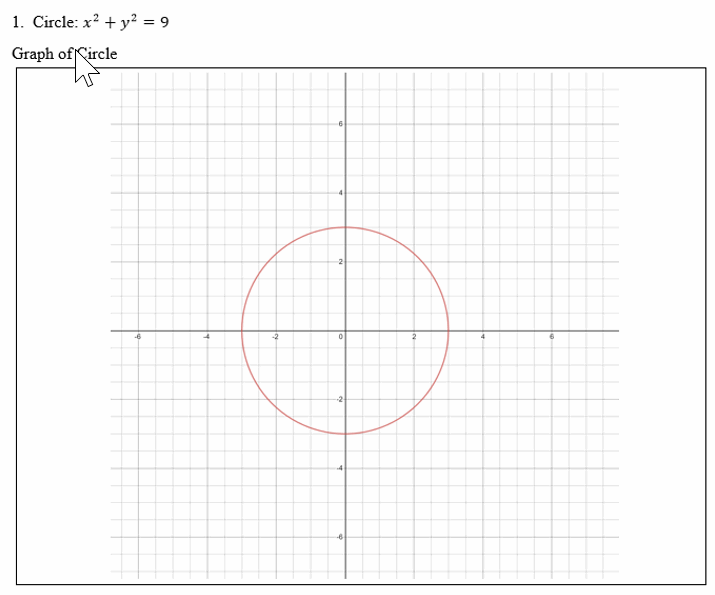
Click on the image to view a larger version.