Try It
Graphing Linear Equations Using a Table of Values Guided Practice
Practice Problem #1
Complete the table for the given equation. Then, plot the coordinates on the coordinate plane.
y = 3x − 4
Enter the x-values into the equation and evaluate for y.
| x | y |
|---|---|
| −3 | blank |
| −2 | blank |
| 0 | blank |
| 2 | blank |
| 5 | blank |
| x | y |
|---|---|
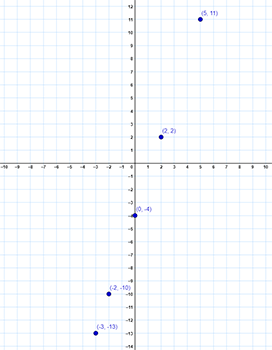
| −3 | −13 |
| −2 | −10 |
| 0 | −4 |
| 2 | 2 |
| 5 | 11 |
Draw a coordinate plane in your notebook and graph the points.
Answer:
Practice Problem #2
Complete the table for the given equation. Then, plot the coordinates on the coordinate plane.
y = x + 7
Enter the x-values into the equation and evaluate for y.
| x | y |
|---|---|
| −2 | blank |
| 0 | blank |
| 3 | blank |
| 5 | blank |
| x | y |
|---|---|
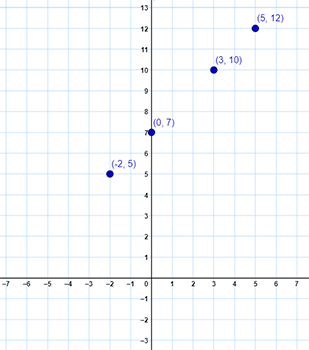
| −2 | 5 |
| 0 | 7 |
| 3 | 10 |
| 5 | 12 |
Draw a coordinate plane in your notebook and graph the points.
Answer:
Matching
Match each equation to its graph.
Hint: You can determine the correct matches by plugging in both the x and y coordinates to check if they work in the equation. For example, if the equation is y = 2x + 3 and we choose the point (3,4) from one of the lines on the existing graphs, we'll plug in the (3,4) coordinates to check if it will work in our equation.
- y = 2x + 3,where y = 4 and x = 3
- 4 = 2(3) + 3
- 4 = 6 + 3
- 4 = 9
- This statement is not true, therefore this is not the correct equation for the line that you chose.
Equations:
- y − x = 6
- y = 3x − 5
- y = −x + 3
- y = 4x + 3
- y = −3x + 5
Graphs:
- Graph A:
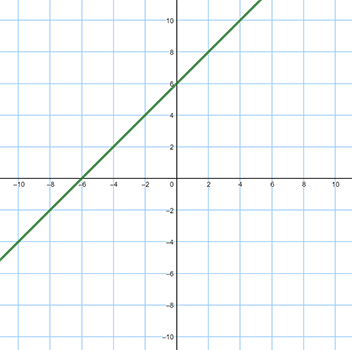
See larger version of Graph A here. - Graph B:
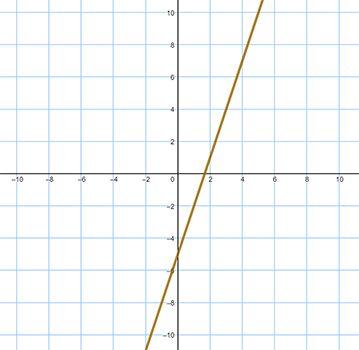
See larger version of Graph B here. - Graph C:
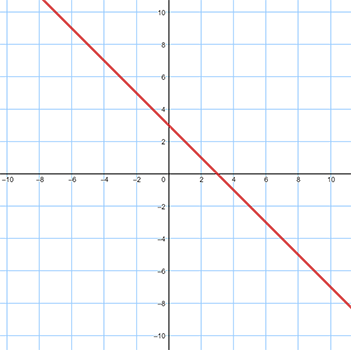
See larger version of Graph C here. - Graph D:
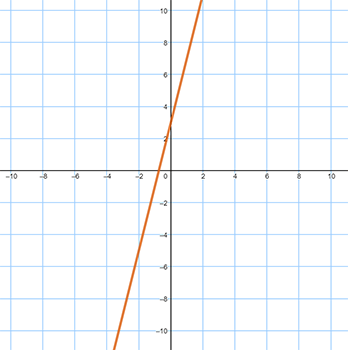
See larger version of Graph D here. - Graph E:
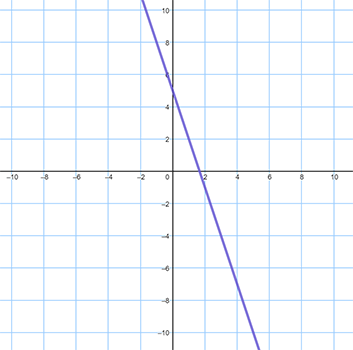
See larger version of Graph E here.
Answers:
- y − x = 6
- y = 3x − 5
- y = −x + 3
- y = 4x + 3
- y = −3x + 5
You've completed these review activities!