Task
Spectrometry Virtual Lab
Scenario
The Crime
The students were excited about the prom. It was a chance to show of new clothes and dance moves. But things turned bad very quickly! It began when someone threw up on the dance floor. Then another student passed out, and another. Soon, an ambulance was called for a student.
The Victims
Police talked to several students who were there.
Victim 1: "I was just dancing. It was so hot in there that I had like five cups of this sports drink. One tasted kind of weird, like when you have blood in your mouth? But there was nothing else to drink."

Victim 2: "I had a cup of one of the blue drinks. I only had one cup, though. It tasted funny. It figures, coming from our cafeteria."

Victim 3: "I barely got there. Our dinner reservation was horrible, so I went straight for the snacks and drinks. I had something blue. It tasted metallic, but I still finished it. My mom always tells me not to get a poured drink like that because someone could sneak something in it."

The Evidence
The police immediately began to gather evidence. Based on information about the punch, police focused their efforts on the snack area. Fortunately, this area had security cameras. The police collected unopened bottles of BluBlast, Lightning Power, and Mountain River from the table. They were also able to collect a cup of the tainted drink from one student. All of the drinks were blue.
Further Evidence
Police talked to two teacher chaperones who were filling the cups for students.
Teacher 1: "It was hot in the gym, just like it always is. There was a run on the drinks. I know a few times I just grabbed whatever bottle was closest to me and poured. I didn't open all of my own bottles."

Teacher 2: "We poured all of the cups ourselves, directly from the bottles. It was really busy, though. One of the students might have opened a few bottles for us."

The Forensic Lab
The doctors treating the students say the symptoms are consistent with copper sulfate poisoning. As the lab technician, you have two goals:
- confirm that copper sulfate was the poison
- identify which sport drink was tainted
You will use a spectrometer to carry out your investigation.
Background
The Science
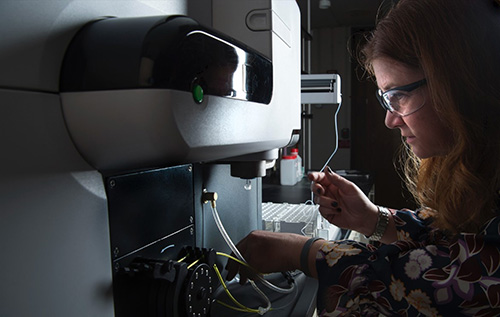
To determine what substances may have been in the drinks, we will use a spectrometer. Spectrometers use light to determine the materials of a substance.
To understand how spectrometers work, you need to understand light. In order for our eyes to see a red liquid, certain wavelengths (or colors) of light are absorbed and others are not.

Spectrometer and Wavelengths
A spectrometer also takes advantage of the separation of different wavelengths of light. The spectrometer projects light toward a cuvette of solution and the molecules in the solution allow some of the wavelengths of light to pass through to reach the spectrometer's detector.
Wavelengths at the Graph Peaks
This graph looks like what we will see when we conduct the experiment. Look at the wavelengths (colors) at the graph peaks.
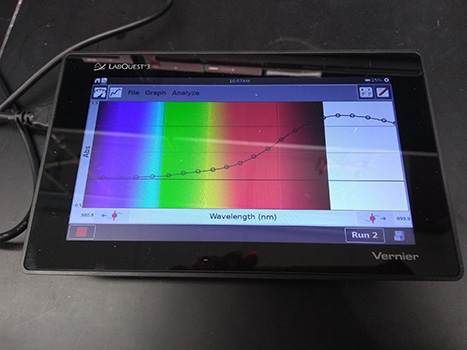
A monitor showing the results from a spectrometer test. The graph's x-axis is wavelength in newton-meters (nm), and the y-axis is absorption (abs). Within the graph is the full spectrum of wavelengths (colors) going left to right. Violet is on the far left, and red is on the far right. On top of the color spectrum are points that create a curved line. The points are lower at the violet and blue wavelengths, and get higher as the wavelengths change to red. The line peaks in the red wavelengths.
Can you see why a particular color is indicated by the graph?
Knowledge Check #1
The example graph peaked within the color _________, indicating that the solution ______________ mostly red light.
- Blue, absorbed
- Blue, reflected
- Red, absorbed
- Red, reflected
Answer: c. Red, absorbed
Link to Case
As the lab technician, you can use the spectrometer to measure the absorbance spectra of the drink in the cups. By comparing this to the absorbance spectra of copper sulfate and untainted bottles of the sports drink, you should be able to:
- identify if copper sulfate was present
- identify which sports drink was tainted
Reflection
Different sports drinks use different combinations of food dyes.
How does this help us identify the drinks using a spectrometer?
The Lab Process
The Equipment
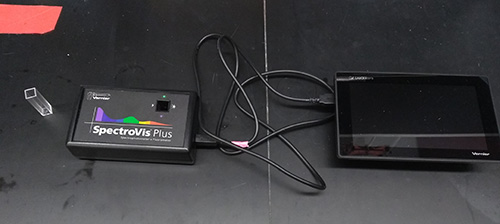
- Vernier SpectroVis Plus
- Cuvette
- 100 ml graduated cylinder and 250 ml beakers
- Plastic Beral pipettes
- 0.1 M CuSO4 (copper sulfate) solution
- Sports drinks matching the ones found at school
- Sample from the tainted drink from school
- Distilled water
Control
First, calibrate the spectrometer in order to have a control sample.
- Prepare a blank by filling an empty cuvette ¾ full with distilled water.
- Open the Experiment menu and select Calibrate ▶ (Spectrometer). The following message appears in the Calibrate dialog box: "Waiting 90 seconds for the device to warm up." After 90 seconds, the message changes to: "Warmup complete."
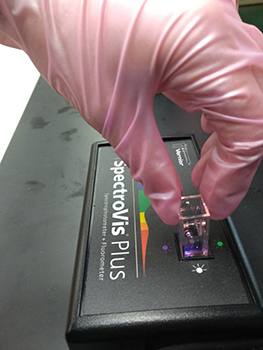
- Place the blank in the spectrometer. Align the cuvette so that the clear sides are facing the light source of the spectrometer. Click "Finish Calibration," and then click "OK."
A small amount of light was absorbed by the distilled water. The spectrometer will subtract this absorbance from subsequent solutions so that only the absorbance caused by the contents of the solution is shown.
Graph:
Does this graph show a proper control?
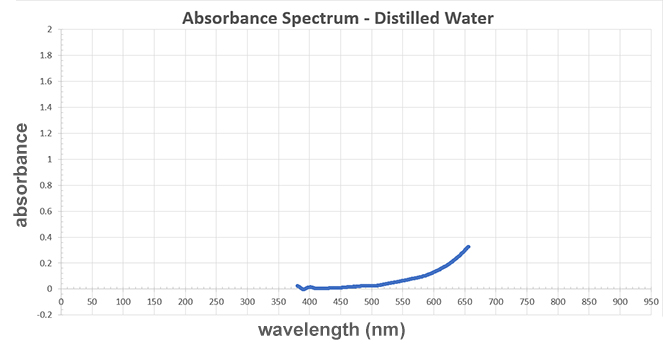
A graph titled "Absorbance Spectrum - Distilled Water." The x-axis represents wavelength measured in newton-meters and the y-axis represents absorbance. The line on the graph starts near 370 wavelength newton-meters and 0.04 absorbance. As the wavelength increases, the absorbance slowly increases. The line ends at 670 wavelength newton-meters and 0.32 absorbance.
Calibration:
The calibration process in action:
Process, Part 1
Next we conduct our experiment on the copper sulfate sample.
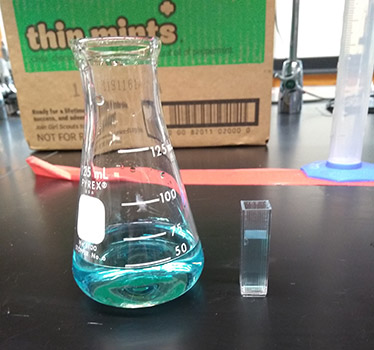
Empty the blank cuvette and rinse it twice with small amounts of a copper sulfate solution. Fill the cuvette ¾ full with the copper sulfate solution.
- Align the cuvette so that the clear sides are facing the light source of the spectrometer.
- Click ▶ Collect. A full spectrum graph of the copper sulfate sample will be displayed.
- Click ■ Stop. Examine the graph, noting the peak or peaks of very high absorbance or other distinguishing features.
- To save your graph, select Store Latest Run from the Experiment menu.
Graph:
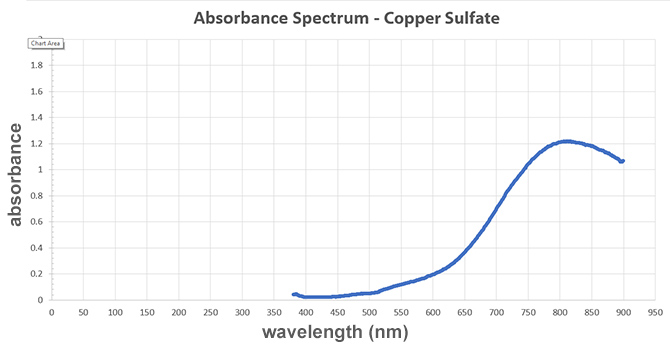
A graph titled "Absorbance Spectrum - Copper Sulfate." The x-axis represents wavelength measured in newton-meters and the y-axis represents absorbance. The line on the graph looks like a smooth S curve. The line begins around 400 newton-meters and increases to a peak at 820 newton-meters. The line curves back down and stops at 900 newton-meters. At the peak, the absorbance value is 1.2, and the minimum absorbance value is almost 0.
Solution:
CuSO4 (copper sulfate) solution:
Process, Part 2
Then repeat for the sports drink and the tainted sample.
- Empty the cuvette and rinse it twice with small amounts of a sports drink mixture. Fill the cuvette ¾ full with the sports drink mixture and place it in the spectrometer. Align the cuvette so that the clear slides are facing the light source of the spectrometer.
- Click ▶ Collect. A full spectrum graph of the solution will be displayed.
- Click ■ Stop. Examine the graph, noting the peak or peaks of very high absorbance or other distinguishing features.
- To save your graph, select Store Latest Run from the Experiment menu.
- Repeat for all sports drink samples.
The Evidence
Viewing the Evidence
We now have the absorbance spectra of distilled water, copper sulfate, untainted drinks (samples A-C), and the tainted sample (sample D).
We can compare the absorbance spectra of the copper sulfate solution with the tainted sample to see if the copper sulfate was used. We can also compare the tainted sample with the unopened sports drinks to see which drink was poisoned.
The Evidence

A graph titled "Absorbance Spectrum - Copper Sulfate." The x-axis represents wavelength measured in newton-meters and the y-axis represents absorbance. The line on the graph looks like a smooth S curve. The line begins around 400 newton-meters and increases to a peak at 820 newton-meters. The line curves back down and stops at 900 newton-meters. At the peak, the absorbance value is 1.2, and the minimum absorbance value is almost 0.
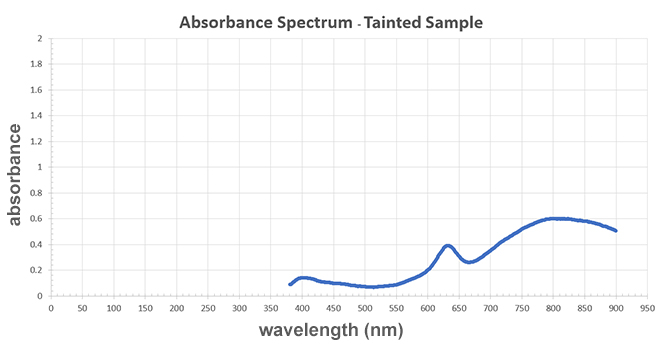
A graph titled "Absorbance Spectrum - Copper Sulfate." The x-axis represents wavelength measured in newton-meters and the y-axis represents absorbance. The line on the graph has three peaks: a slight peak near the beginning of the line at 400 wavelength newton-meters, a sharp peak in the middle at 626 newton-meters, and a smooth curve that peaks at 800 newton-meters. Each peak's absorbance value is 0.15, 0.4, and 0.6 respectively, so the last peak at 800 newton-meters is the highest. The minimum absorbance value is 0.1 at 500 newton-meters, which is in-between the first and second peaks.
Based on the evidence above, is copper sulfate present in the tainted sample (sample D)?
- Yes
- No
Answer: a. Yes. While the absorbance values are not equal, the peak absorbance occurs at the same wavelength, indicating that the same substance is present, just at different concentrations.
Further Evidence
Now, compare the tainted sample with the three drinks (samples A–C). Which drink was poisoned?
Tainted Sample/Sample D:

A graph titled "Absorbance Spectrum - Copper Sulfate." The x-axis represents wavelength measured in newton-meters and the y-axis represents absorbance. The line on the graph has three peaks: a slight peak near the beginning of the line at 400 wavelength newton-meters, a sharp peak in the middle at 626 newton-meters, and a smooth curve that peaks at 800 newton-meters. Each peak's absorbance value is 0.15, 0.4, and 0.6, respectively, so the last peak at 800 newton-meters is the highest. The minimum absorbance value is 0.1 at 500 newton-meters, which is in-between the first and second peaks.
BluBlast/Sample A:
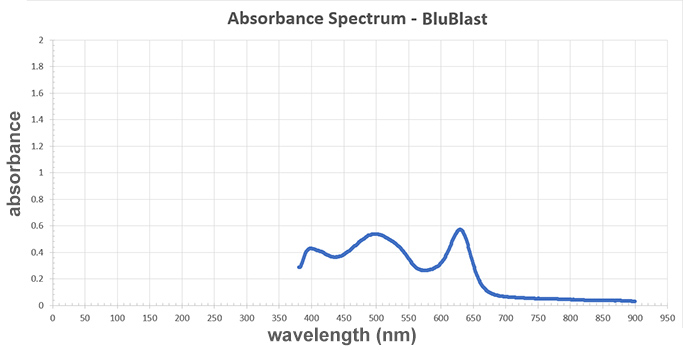
A graph titled "Absorbance Spectrum - BluBlast." The x-axis represents wavelength measured in newton-meters and the y-axis represents absorbance. The line starts around 380 newton-meters, has three peaks, and then decreases towards 0 until the line ends at 900 newton-meters. The three peaks are located at 400, 500, and 625 newton-meters and each peak's absorbance value is 0.45, 0.55, and 0.6, respectively. There are three minimum absorption values: 0.35 at 425 newton-meters, 0.3 at 575 newton-meters, and almost 0 at 900 newton-meters.
Lightning Power/Sample B:
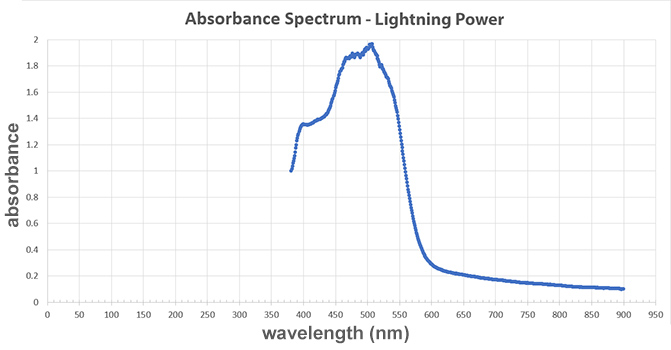
A graph titled "Absorbance Spectrum - Lightning Power." The x-axis represents wavelength measured in newton-meters and the y-axis represents absorbance. The line starts at 1 absorbance at around 380 newton-meters. The line sharply increases into a plateau around 400 newton-meters, then increases again into a peak of 2 absorbance at 500 newton-meters. A sharp decrease follows that peak, which becomes less steep at 600 newton-meters. The line ends at its minimum absorbance of 0.1 at 900 newton-meters.
Mountain River/Sample C:
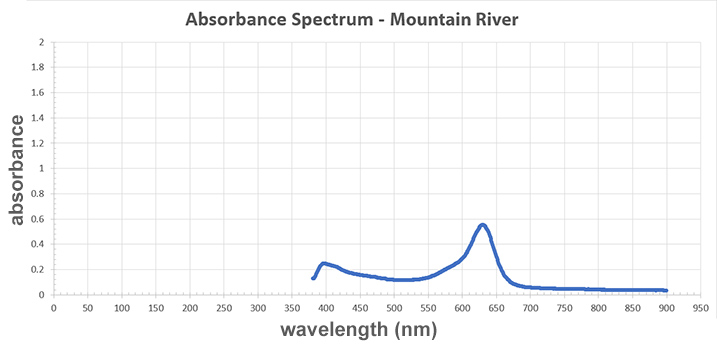
A graph titled "Absorbance Spectrum - Lightning Power." The x-axis represents wavelength measured in newton-meters and the y-axis represents absorbance. The line starts with a slight peak of 0.3 absorbance at 400 newton-meters. The line then creates a large "u" with a minimum of 0.1 at 500 newton-meters. The "u" rises into the highest peak of 0.6 absorbance at 625 newton-meters. After the peak, the line sharply decreases and then flattens to almost 0 absorbance at 750 to 900 newton-meters.
Conclusion
You have identified the tainted sports drink. Now that the police know which drink was tainted, they can use video evidence to identify who handled that drink bottle.
Remember to complete your lab report! Your findings will be shared with law enforcement and used, in part, to resolve or move this case forward.
Credits
Unless otherwise noted, all text and images featured in this presentation are original works created by ACCESS, available by public domain, and/or licensed by iStock or Articulate.
Adapted from "Visible Spectra of Commercial Dyes: the Forensic Version" © Vernier Software & Technology
Thanks to the following volunteers and their supervisor Dr. Paul Rupar for conducting this experiment: Brendan Rosamond, Michael Gilmore, Olivia Person, Kayla Veal, Emily Linn, and Hugh Hendricks.