Try It
Change in Supply Practice
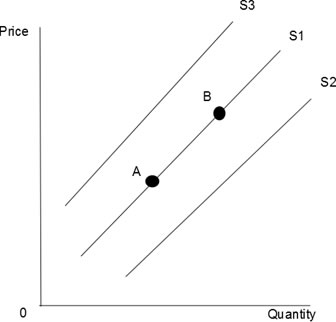
Use the chart below to help you determine the BEST answer to the given scenarios.
- A to B
- B to A
- S1 to S2
- S1 to S3
- The government increases the minimum wage. What will happen to the supply curve?
- A to B
- B to A
- S1 to S2
- S1 to S3
Answer: d. S1 to S3. The supply curve shifts to the left, indicating a decrease in supply. Supply decreases as the cost of labor has increased for businesses.
- The cost of making toys has increased because the prices of red, yellow, blue, and green paint have increased. What will happen to the supply curve for toys?
- A to B
- B to A
- S1 to S2
- S1 to S3
Answer: d. S1 to S3. The supply curve shifts to the left, indicating a decrease in supply.
- The government places a plastic tax on all companies who use plastic. What will happen to the supply curve for toys?
- A to B
- B to A
- S1 to S2
- S1 to S3
Answer: d. S1 to S3. The supply curve shifts to the left, indicating a decrease in supply.
- Mattel expects the prices of toys to fall in the near future. What will happen to the supply curve for toys?
- A to B
- B to A
- S1 to S2
- S1 to S3
Answer: d. S1 to S3. The supply curve shifts to the left, indicating a decrease in supply.
- A new toy company begins selling toys. What will happen to the supply curve for toys?
- A to B
- B to A
- S1 to S2
- S1 to S3
Answer: c. S1 to S2. The supply curve shifts to the right, indicating an increase in supply.
You have completed this activity!