Learn
Vocabulary
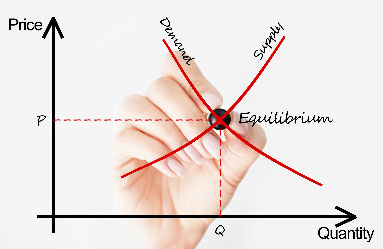
The supply curve shows how the quantity of a good supplied depends on the price. According to the Law of Supply, as the price of a good falls, the quantity supplied falls. Therefore, the supply curve slopes upward to the right. Remember sUPply goes UP. As was true with the Law of Demand, events can take place that cause the supply curve to shift indicating either an increase or a decrease in supply. Study the following economics terms and note that although each sounds similar, the terms represent very different aspects of economics.
Supply
We now need to think like a business owner. We are no longer the consumer (as we were when we studied demand); we are now the producer and supplier of goods and services.
Supply is the amount of a product that would be offered for sale at all possible prices in the market. That means the amount a producer will offer when the price is: $1, $2, $5, $100, $1000, etc.
The Law of Supply states that suppliers will normally offer more for sale at higher prices and less at lower prices. Remember we are now the ones who are creating the goods and services. In a market economy, it is only natural that we are willing to supply more of a product when the price for which it is selling is higher.
Supply Curves
A supply curve is a graph which shows the amount a producer will make varies depending on the price that consumers will pay. This is a graphic representation of how much customers are willing to pay.
Change in the Quantity Supplied: Producers change the quantity they supply for a product when the price changes.
- At a high price, producers supply more.
- At a low price, producers supply less.
What made this happen? Price. Producers changed the quantity supplied of a good in response to a change in price. This happens all the time! This is referred to as movement along the curve.
Open Change in Quantity Supplied in a new tab
An individual supply curve illustrates how the quantity that a producer will make varies depending on the price that will prevail in the market. For example, how many cans of Coca-Cola will sell at all possible prices?

A market supply curve illustrates the quantities and prices that all producers will offer in the market for any given product or service. For example, how many cans of soft drinks of any brand will sell at all possible prices?

Supply Schedule
Economists analyze supply by listing quantities and prices in a supply schedule. A supply schedule is a representation of the supply graph in the form of a table.
| Price ($) | Supply |
|---|---|
| 1 | 2 |
| 2 | 5 |
| 3 | 10 |
| 4 | 20 |
| 5 | 50 |
In the supply schedule, there is one column for price in dollars and the other for supply.
- At a price of $1, the supply is 2 units.
- At a price of $2, the supply is 5 units.
- At a price of $3, the supply is 10 units.
- At a price of $4, the supply is 20 units.
- At a price of $5, the supply is 50 units.
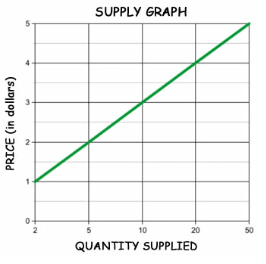
Supply Graph
When the supply data is graphed, it forms a supply curve with an upward slope. This is a graphic representation of the data provided from the supply schedule.
Elasticity of Supply
Elasticity is determined by how responsive supply is to changes in price.
- Supply is elastic when a small increase in price leads to a larger increase in output.
- Supply is inelastic when a large increase in price causes little change in supply.
- Supply is unit elastic when a change in price causes a proportional change in supply.
Determinants of Elasticity of Supply
Determinants of supply elasticity are related to how quickly a producer can act when the change in price occurs.
If adjusting production can be done quickly, the supply is elastic. If production is complex and requires much advance planning, the supply is inelastic.
Another factor is substitution.
- If substitution is easy, the supply is elastic.
- If substitution is difficult, the supply is inelastic.
Change in Supply and ROTTEN Acronym
The entire market supply changes so much so that we need an entirely new curve showing that, at each and every price, producers are willing to supply more or less. What could possibly have happened to have caused a shift of the original supply curve? Price? No, that changes our quantity that we are supplying. Here we are looking for a change in supply.
The causes of curve shifts are collectively referred to as the non-price determinants of supply.
- More supply, curve shifts to the right.
- Less supply, curve shifts to the left.
The non-price determinants of supply follow an acronym R O T T E N where every letter stands for one of these determinants:
- Resource (input, factors of production prices): The inputs of production are the factors of production that include Land, Labor, Capital (Machinery) and Entrepreneurship. Any costs associated with these essential factors can shift the supply curve. Examples include:
- Raise minimum wage and the input cost of labor rises resulting in less supply.
- A drought occurs in Alabama and the cost of land rises because irrigation becomes necessary for the harvesting of crops.
- Get a new piece of machinery (capital) and your production becomes more efficient and the supply curve shifts to the right.
- Other competitors: When several companies need the same resource for their production, they all try to buy the resource. Take a renewal resource like rubber.
- The rubber plantation owners in Central America will sell their product to the highest bidder and this could be tire companies.
- The supply curve for the tire companies will shift to the right because they will now be able to manufacturer the tires.
- The supply curve for shoes that use rubber soles will shift to the left however because they will not have the resource needed to make the shoes.
- Technology: Better technology leads to more production and the curve shifts to the right. A technological glitch leads to a curve shifting to the left.
- Taxes, government
regulations, and government subsidies (benefits to businesses), regulations imposed by the government can shift the supply curve.
- Give the business a tax break and the supply curve shifts to the right.
- Give the business a new tax burden and the supply curve shifts to the left.
- Expectations: If suppliers knew that one of their key inputs would suffer a shortage in the market, the supplier would adjust their production and the curve would shift accordingly. Perhaps more supply now in the short run and less supply later in the long run.
- Number of sellers: More lemonade stands on the sidewalk, more supply resulting in the curve shifting the right.
Open Change in Supply and Explanation of ROTTEN in a new tab