- Introduction
 Learn
Learn- Try It
- Task
Learn
|
Before we start the lesson, read the definitions of vocabulary that will be introduced in the lesson.
Watch Classical Economics. Transcript
With your knowledge of the AS and AD curves, and the position of equilibrium relative to Full Employment, we will now turn our attention to correcting for inflationary or recessionary times. While there are different economic theories about the best way to correct an economy this lesson will focus on only two, Classical Economics and Keynesian Economics.
The basics of Classical economics:
The principles of Classical economics are represented in the graph below when the economy is in a recession. We start with the economy in a recession, which is identified by PL1 and Q1 in the graph below. According to a classical economist, with the unemployment in the economy, eventually wages and prices of resources will decrease. When the costs of inputs decrease the AS curve will shift to the right and achieve equilibrium again at a lower price level (PLf) and a higher output (Yf).
The principles of Classical economics can also be illustrated when the economy is booming or doing well. The graph below represents the ideas of a classical economist in a boom time. A booming economy and high inflation is represented by PL1 and Q1 in the graph below. According to a classical economist, with low unemployment and a higher price level, eventually the cost of wages and resources will increase. With the cost of inputs increasing the AS curve will shift to the left and achieve a new equilibrium at a higher price level (PLF) and a lower output (Yf).
These two examples show the basic beliefs of a classical economist. If you leave the economy alone, any problems will correct themselves. Watch Keynesian Economics.
The ideas of classical economics lasted until the Great Depression of the 1930s. It was at this time that Keynesian Economics (pronounced "CANES-ee-un") was introduced to President Franklin Roosevelt by John Maynard Keynes. The persistence and the depth of depression could not be explained by classical economists. Keynes (pronounced "Canes") offered a new approach to looking at the economy. He believed the economy would not achieve full employment in the long run, as espoused by classical economists, unless the government stepped in and affected aggregate demand. The basics of Keynesian Economic thoughts:
You can see the idea of Keynes in the graph below. Start with the economy in a recession, which is identified by PL1 and Q1 in the graph below. According to Keynes, with unemployment in the economy, the government needs to increase aggregate demand by lowering taxes and increasing spending. By lowering taxes consumers have more disposable income which means their consumption will increase. Since the components of Aggregate demand include C and G, increasing both will shift AD to the right. A new equilibrium will be achieved with a higher price level (PLf) a greater output (Yf).
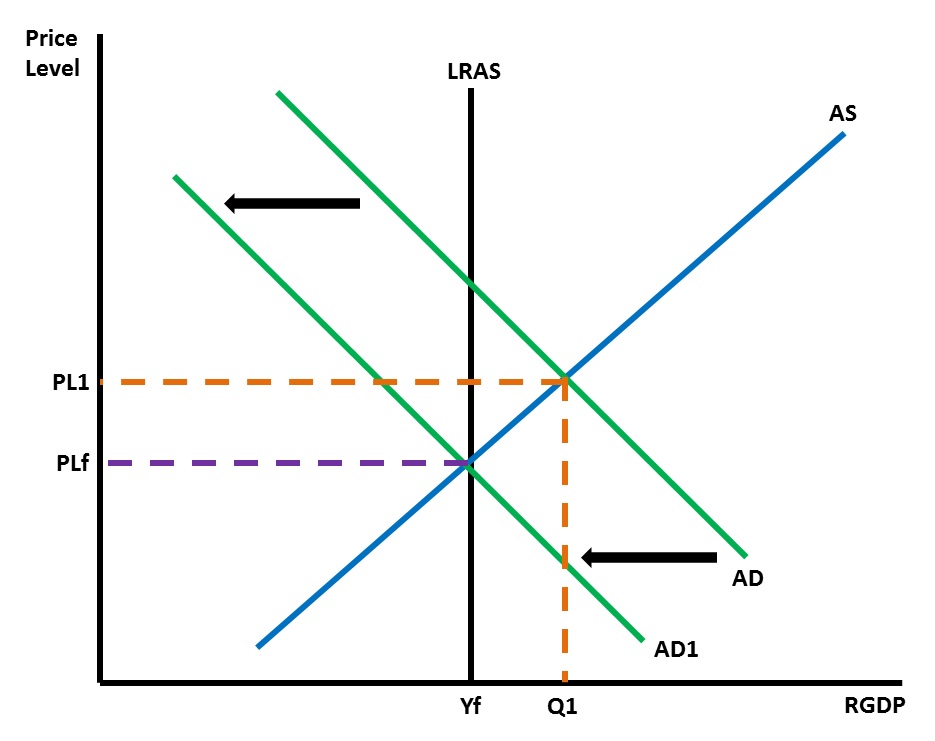
You can see the idea of Keynes in the graph below. Start with the economy experiencing high inflation, identified by PL1 and Q1 in the graph below. According to Keynes, with inflation the biggest problem in the economy, the government needs to decrease aggregate demand by increasing taxes and decreasing spending. By increasing taxes consumers have less disposable income which means their consumption will decrease. Since the components of Aggregate demand include C and G, decreasing both C and G will shift AD to the left. A new equilibrium will be achieved with a lower price level(PLf) a smaller output (Yf).
Watch the two videos below to learn more about Keynesian Economics, fiscal policy and monetary policy. Watch Monetary Policy.
The other entity tasked with trying to help the economy recover from a recession or control inflation is the Federal Reserve. Read A Closer Look at Open Market Operations for a review of monetary policy. The money supply can be manipulated to help correct the economy. The graph below shows this correction. We will start with the economy in a recession, which is identified by PL1 and Q1 in the graph below. The Federal Reserve, faced with a stagnant economy, or an economy that is not growing, and high unemployment, would use an expansionary money policy would help to correct the situation. By increasing the money supply and decreasing the interest rates businesses and consumers would borrow more money. By increasing the money supply and decreasing the interest rates businesses and consumers would pay to borrow more money. By increasing consumption and investment Aggregate Demand would shift to the right. The economy would achieve a new equilibrium at a higher price level (PLf)and a higher output (Yf).
Keeping in mind the tools of the Federal Reserve you can see how manipulating the money supply will help correct the economy. This is shown in the graph below. We start with the economy experiencing high inflation, which is identified by PL1 and Q1 in the graph below. The Federal Reserve, faced with high inflation, would use a contractionary monetary policy to take money out of the economy to correct the situation. By decreasing the money supply and increasing interest rates it would cost businesses and consumers more to borrow money. By decreasing consumption and investment Aggregate Demand would shift to the left. The economy would achieve a new equilibrium at a lower price level (PLf) and a lower output (Yf).
One problem in the economy that confounds both classical and Keynesian economists is called stagflation. Stagflation is caused by shifting the AS curve to the left. In this situation you will see an increase in the price level and an increase in unemployment. This situation is the worst because not only are people out of a job, but everything costs more. The problem for Keynesian economists was evident during the 1970s with the oil crisis. With the cost of oil increasing rapidly the cost of everything increased, the economy slowed and people were put out of work. Looking at the graph shows that any attempt to increase AD by the government would have made inflation even worse. The classical solution by allowing the economy to correct itself was met with much criticism from the people who were suffering. In the case of the 1970s the Federal Reserve eventually implemented a contractionary monetary policy to eradicate the high inflation from the economy. The 1970s were followed by periods of high economic growth during the 1980s and 1990s. Watch Stagflation to gain a perspective on stagflation. If you need an explanation of all the graphs used in the lesson, watch the compilation below.
Now that you have a basic understanding of the problems for an economy and how monetary and fiscal policy are used to either stimulate or slow down the economy, read Monetary and Fiscal Policy to see a more detailed summary. With your understanding of fiscal and monetary policy watch Keynes vs. Hayek to hear a recent discussion on the disagreements over Classical and Keynesian economics. Keep in mind that Friedrich Hayek is a classical economist. The word austerity is the term describing the cutback in government spending going on in some European countries that are trying to get debt and government spending under control. |
 Classical economics is a theory introduced by the "Father of Economics," Adam Smith. His idea states that if you leave the economy alone any sort of problem will correct itself.