|
|
Objectives: After studying the Module 2 Preparation Chip, you will be able to:
There are many ways to write an algorithm. You can write it as a list of statements or draw a picture. You have probably heard many people say that a picture is worth a thousand words. In some cases, the solution to a problem is more evident from a picture than from a list of instructions. Programmers use flowcharts to represent an algorithm graphically; however, a flowchart is not a program.
Flowcharts are useful during the planning step of a program.
|
Flowcharting Flowcharts are a series of boxes of various shapes connected by lines with arrows showing the sequence of instructions to be followed. The three most common flowchart symbols are the oval, the parallelogram, and the rectangle. They are also referred to as the terminal symbol, the input/output symbol, and the processing symbol, respectively. |
|
Terminal
Symbol |
|
Input/Output
Symbol |
||
| Processing
Symbol A rectangle depicts a calculation and shows the formula to be used. |
The programs you have written so far in this course have contained only output. The programs used PRINT to display information for the user to read. As you continue working in the course your programs will often be divided into three sections: INPUT - > PROCESSING -> OUTPUT
Before we define these sections in program terms, let's look at an everyday example.
Have you ever made a sandwich? How about a peanut butter sandwich? Stop for a minute and think about the steps you took to create that sandwich.
| Flowchart | Pseudocode | |
|---|---|---|
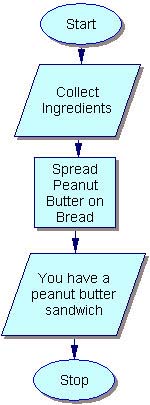 |
On the left is a flowchartHere's the flowchart: a series of boxes of various shapes connected by lines with arrows showing the order to perform the various instructions. The terminal
symbols indicate where to begin and end. As a general rule, the flow should be shown from top to bottom and from left to right. Always make sure the arrows point in the correct direction. On the right is Pseudocode.Pseudocode (pronounced Sue - doe - code) means "false" code. When writing pseudocode, you will write notes telling what should happen in each section of the program. From these notes, you can write the program. Notice the pseudocode is in plain words, not program code and no graphics are used. |
INPUTCollect Ingredients
PROCESSINGSpread peanut butter on bread and cover with the other piece of bread OUTPUTYou have a peanut butter sandwich |
Were the instructions clear? Would you be able to create a sandwich by following them? When you develop algorithms for your programs, the steps will need to be clear to help you write your program.
Notice how the order of the steps matter. You can't have OUTPUT before the INPUT and PROCESSING have been completed. The same will be true for your programs.
Also note, listing the instructions for making a sandwich is not the same as physically making the sandwich. The same is true of flowcharts and programs. Developing the flowchart is not the same as coding the program. Knowledge of how to write an algorithm does not imply knowledge of how to write a program. When given a problem, you are the one who must come up with the program that the computer must follow in order to solve the problem.
The ProblemA man went to the mall to purchase CD's. The price for a CD was $10. He purchased 8. Write a program that will calculate how much is spent for the CD's.
Display how many CD's were bought and how much it cost in sentence format. Don't forget to use "good programming practices". |
PseudocodeINPUTThe price for a CD was $10 each. He purchased 8 CD's. PROCESSINGtotal cost equals price times the quantity OUTPUTDisplay how many CD's were bought and the total cost in sentence format. |
Graphic Flow Chart |
|
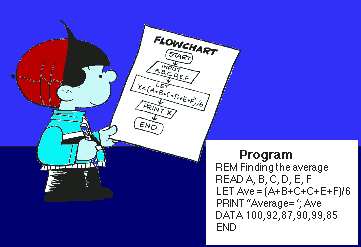
Once pseudocode or a flowchart depicting an algorithm is created, it is fairly easy to write a program. To the right is a QBASIC program to go along with the sample flowchart. Please note the following: REM, CLS and COLOR are not in the flowchart but need to be in your program. Stop is used in the flowchart, but END is used in the program. There is no corresponding keyword for Start. We used meaningful variable names and there was a number at the end of the variable names. You may be asking, "What is a variable?" You will learn about variables soon! Translating the rest of the flowchart to a program is pretty straightforward. LET (which you will learn about later in this Module) is represented by the Processing symbol and PRINT is represented by the INPUT/OUTPUT symbol. |
REM CD COSTS |
Now it's your turn. Open QBASIC and type the program above. Run it a few times and study how it works. When it runs, you should see a sentence on the OUTPUT screen telling the quantity and cost of the CDs purchased. Try changing the value for the price of a CD or the quantity purchased and run the program again. Notice how the output changed.
Reading a problem and identifying the key elements as Input, Processing, or Output is a skill.
A text version is also available.
|
You will be creating either Pseudocode or Flowcharts throughout this course. There are many ways to do this. Let's look at two options. Pseudocode
Flowcharts
|
 |
A
flowchart and a program are the same thing.
|
Your assignment for this lesson has two parts.
Before moving on to the next assignment, be sure that you can do the following:
Pseudocode is a useful technique to organize the instructions into an algorithm which can be used as a "check list" of tasks to be completed during the development of the code for a program.
Flowcharting is a more formal technique for showing a "picture" of an algorithm. It is a technique also used in many other situations. You will gain a practice reading flowcharting in this course.
 |
After you have completed the Quiz for Assignment 02.04, please move on to the next assignment. |
|
|
|