Introduction
Would you rather read a book with no pictures or a book with pictures? Would you rather read a paragraph of statistics or see a visual representation of them? Most of us enjoy seeing a visual of the material we are reading or trying to understand. Take a look at the two pictures below. Both of them display the same information, the number of males and females who chose each of the primary colors as their favorite. Now decide which representation helps you to remember the results of the survey more.
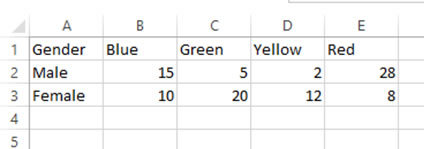
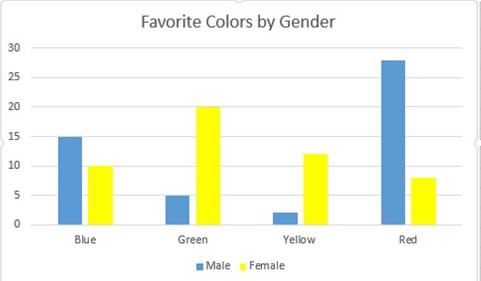
It would probably be safe to say that the chart will help you to understand and remember the results more than the rows and columns of data.
Charts are useful for summarizing and drawing conclusions. Charts provide a way of presenting, reading, and comparing data in a picture form. While chart data probably originated as a word processing table or as a spreadsheet the visual it provides helps the reader to create a mental image that will aid in understanding and remembering the information.
In this unit, you will learn the importance of charts and will practice reading them to understand information.
| Lesson Objectives |
|
Following successful completion of this lesson, students will be able to...
Enduring Understandings
The above objectives correspond with the Alabama Course of Study: Business Technology Applications standards: 6 and 21 This lesson incorporates the following Literacy Standards: R1, R2, R3, R4, R5, R6, R10, W1, W2, W3, W4, W5, and W6 |
![]()
![]()