Try It
Determine the Line of Best Fit
Problem #1
The table shows the number if farms operating in the United States from 1998 through 2006.
| Year (since 1998) | Number of Farms (in thousands) |
|---|---|
| 0 | 2192 |
| 1 | 2187 |
| 2 | 2167 |
| 3 | 2149 |
| 4 | 2135 |
| 5 | 2127 |
| 6 | 2113 |
| 7 | 2009 |
| 8 | 1089 |
Use Geogebra's spreadsheet to find the line of best fit.
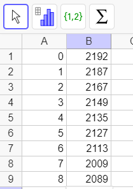
Step 1: In the spreadsheet enter the Years in column A and the Number of Farms in column B.
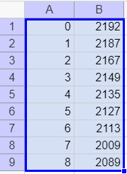
Step 2: Highlight the range of cells from A1:B9.
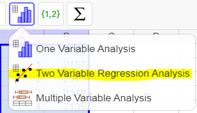
Step 3: Click on the bar chart and choose Two Variable Regression Analysis.
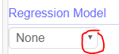
Step 4: Below Regression Model, click on the down arrow and choose Linear.
Step 5: You should now have an equation of the form y = mx + b below the Regression Model.
y = ?
Answer: y = -17.9333x + 2201.5111
Problem #2
Mary decides to run a 5K road race every Saturday morning for the next two months. The table shows the number of miles she runs per week, along with her weekly 5K results.
| Miles Run (per week) | 5K Time (min) |
|---|---|
| 10 | 42 |
| 12.5 | 40 |
| 15 | 36 |
| 17.5 | 31 |
| 20 | 30 |
| 22.5 | 27 |
| 25 | 26 |
Use Geogebra's spreadsheet to find the line of best fit.
y = ?
Answer: y = -1.1429x + 53.1429
Problem #3
The table shows the average daily temperature of a small town in Alabama since January 1st.
| Days | Temperature (°F) |
|---|---|
| 0 | 62 |
| 2 | 60 |
| 4 | 67 |
| 6 | 63 |
| 8 | 81 |
Use Geogebra's spreadsheet to find the line of best fit.
y = ?
Answer: y = 2.05x + 58.4