Learn
Piecewise Function
Piecewise functions are functions that are defined to be smooth functions for specific intervals of the independent variable, most commonly the x-variable.
You will learn how to graph piecewise functions by using your knowledge of graphing other functions.
Things to remember:
- A closed circle (filled in) ● , ≥ , ≤ , or = indicates that this point is part of the graph.
- An open circle (not filled in) ○ , > or < indicates that this point is not part of the graph.
A piecewise function often looks like pieces of graphs glued together. These pieces may all be linear or a mixture such as:
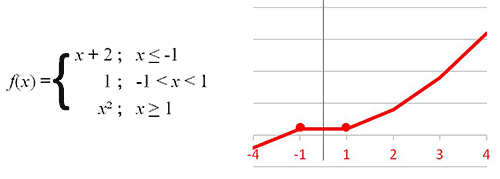
When graphing a piecewise function, you will want to focus on where the changes in the graph occur. It could be continuous (there are no “gaps” or “breaks” in the plotting). Or, it could be discontinuous (having breaks, jumps, or holes) as seen in the example below.
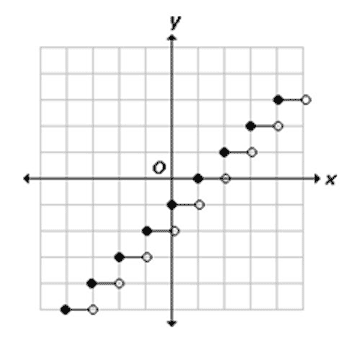
Step Function
Some functions are not easily written as a formula. On a graph, a piecewise function can look like a flight of stairs. This is called a step function.
The graphs of a step function have lines with an open circle on one end and a closed circle on the other to indicate inclusion, like number line inequality graphs.
The figure below shows the graph of a step function f(x) = [x-1] which is a greatest integer function.
You can easily investigate the effects of the parameters on the step function by using the sliders in the interactive accessed below. Note that the function color changes with the signs of a and b, for a visual clue.
Also note that once the steps are a certain distance from the origin, the endpoints no longer appear.
Open the Step Function Explorer a-b Parameters Geogebra page. Use the sliders on the top left of the graph to investigate the effects of parameters a and b on f(x) = a[bx] by varying their values.
Open Construct a Piecewise Function to Model a Real-World Situation in a new tab
Example #2
The table below lists postage for letters weighing as much as 3 oz.
| Weight up to | Postage Price |
|---|---|
| 1 oz. | $0.37 |
| 2 oz. | $0.50 |
| 3 oz. | $0.63 |
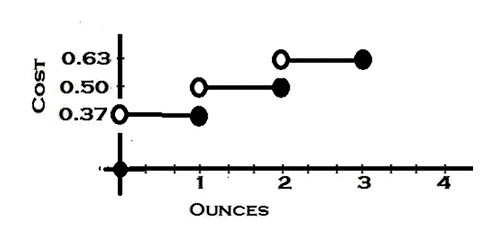
What is the postage for a letter weighing 1.4 oz?
Answer: $0.50
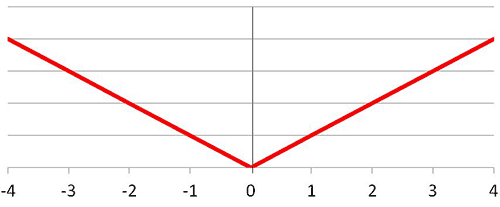
Absolute Value Function
The Absolute Value Function is one of the most recognized piecewise functions. It has two pieces. In this graph, the two pieces merge at the point (0,0). This is the graph of f(x) = |x|
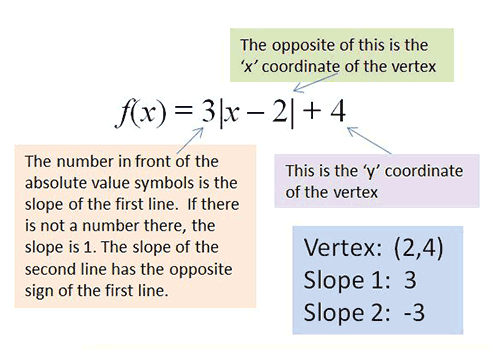
To graph f(x) = 3|x – 2| + 4, you will want to identify the vertex and the slope.
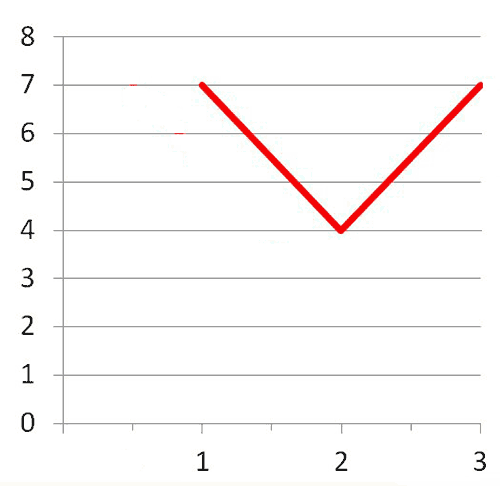
Below is a breakdown of this function: f(x) = 3|x – 2| + 4