Absolute Value Functions
An absolute value function is a function which involves finding the absolute value. The standard equation for an absolute value function is:
y = |x|
f(x) remember, this means the same thing as "y ="=
|x|
The equation above will give you the parent graph of an absolute value function. A parent graph is the graph from which all other functions are built.
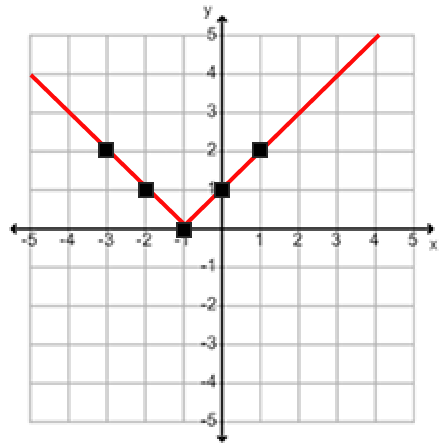
Parent Graph
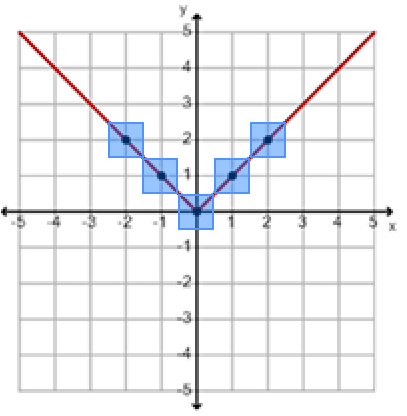
To graph this function, you will create an x-y table. When you substitute for the value of x, you will determine the absolute value of x to calculate the y-value. After you calculate the y-coordinate, plot the ordered pair on the coordinate plane.
| x | y | Ordered Pair |
| -2 | |-2| = 2 | (-2, 2) |
| -1 | |-1| = 1 | (-1, 1) |
| 0 | |0| = 0 | (0, 0) |
| 1 | |1| = 1 | (1, 1) |
| 2 | |2| = 2 | (2, 2) |
Vertex of the Graph
You will notice that the graph looks like a "V". The point of the "V" is the minimum value for the graph. The minimum value of a graph is the lowest point on the graph. This minimum value is also called the vertex of the graph.
The minimum value and vertex for the parent function is (0,0).
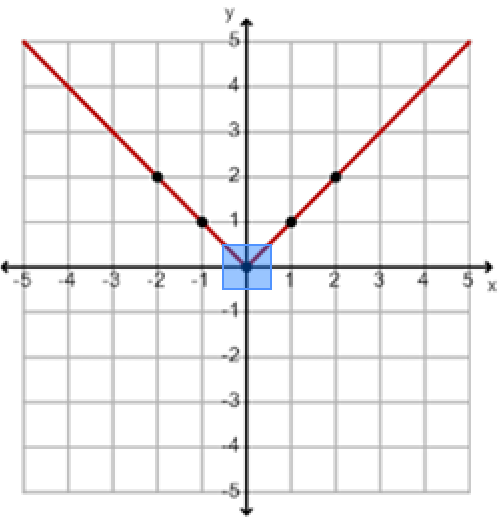
Absolute Value Function as a Piecewise Function
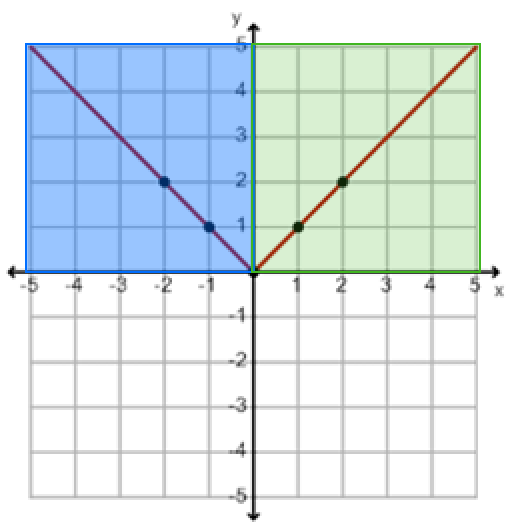
The absolute value function, y =|x| is a piecewise function. It is a combination of a line with a negative slope from negative infinity to 0, and a line with a positive slope from 0 to positive infinity.
The absolute value function, y =|x| can be written as this piecewise function: f(x)={-x, x < 0, x, x ≥ 0
Example #1
Graph f(x) = |x| - 3 using the table below. Determine the vertex and describe the translation from y = |x|.
| x | y | Ordered Pair |
| -2 | |-2| - 3 = 2 - 3 = -1 | (-2, -1) |
| -1 | |-1| - 3 = 1 - 3 = -2 | (-1, -2) |
| 0 | |0| - 3 = 0 - 3 = -3 | (0, -3) |
| 1 | |1| - 3 = 1 - 3= -2 | (1, -2) |
| 2 | |2| - 3 = 2 -3 = -1 | (2, -1) |
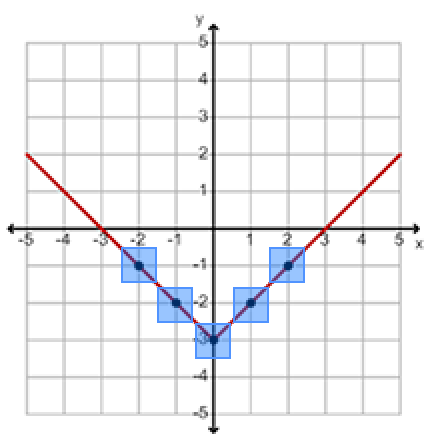
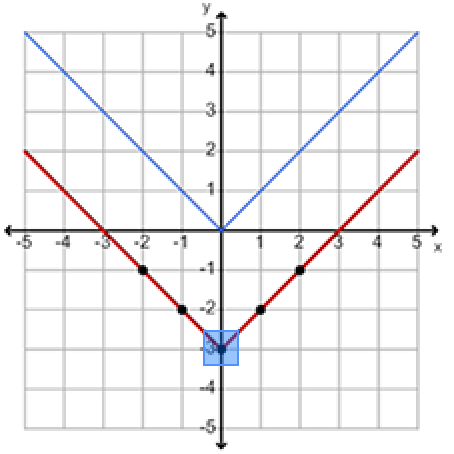
Graph f(x) = |x| - 3 using the table. Determine the vertex and describe the translation from y = |x|.
The vertex of the graph is at (0, -3). This point is also the minimum point.
You should notice that you have a -3 at the end of the equation. This number is the constant and controls the vertical translation of the graph. This graph has been translated three units down from the parent function f(x) = |x|.
Example #2
Graph y = |x| + 1 using the table. Determine the vertex and describe the translation from y = |x|.
Complete the table.
| x | y |
| -2 | |-2| +1 = 2 +1 = 3 |
| -1 | |-1| +1 = 1 +1 = 2 |
| 0 | |0| +1 = 0 +1 = 1 |
| 1 | |1| + 1= 1 +1= 2 |
| 2 | |2| + 1= 2 +1 = 3 |
Plot the points on the coordinate plane.
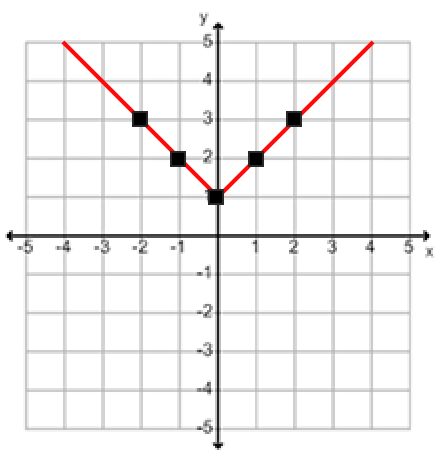
The vertex of the graph is at (0, 1). This point is also the minimum point.
Since you have + 1 on the end of the equation, your graph is translated up one unit from the parent function y = |x|.
Example #3
Graph f(x) = |x - 2| using the table. Determine the vertex and describe the translation from y = |x|.
Complete the table.
| x | y |
| 0 | |0 - 2| = |-2| = 2 |
| 1 | |1 - 2| = |-1| = 1 |
| 2 | |2 - 2| = |0| = 0 |
| 3 | |3 - 2| = |1|= 1 |
| 4 | |4 - 2| = |2| = 2 |
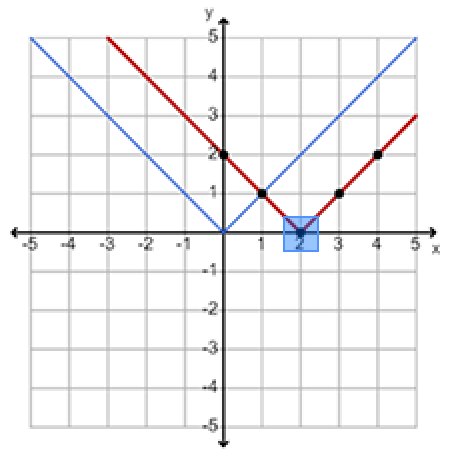
Plot the points on the coordinate plane.
| x | y | Ordered Pair |
| 0 | |0 - 2| = |-2| = 2 | (0, 2) |
| 1 | |1 - 2| = |-1| = 1 | (1, 1) |
| 2 | |2 - 2| = |0| = 0 | (2, 0) |
| 3 | |3 - 2| = |1|= 1 | (3, 1) |
| 4 | |4 - 2| = |2| = 2 | (4, 2) |
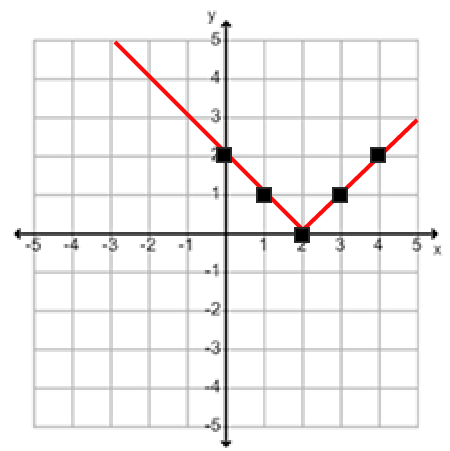
The vertex of the graph is at (2, 0). This point is also the minimum point.
Since you have -2 on the inside of the absolute value, your graph is translated two units to the right from the parent function y = |x|.
Example #4
Graph y = |x + 1| using the table. Determine the vertex and describe the translation from y = |x|.
Complete the table.
| x | y |
| -3 | |-3 + 1| = |-2| = 2 |
| -2 | |-2 + 1| = |-1| = 1 |
| -1 | |-1 + 1| = |0| = 0 |
| 0 | |0 + 1| = |1|= 1 |
| 1 | |1 + 1| = |2| = 2 |
Plot the points on the coordinate plane.
| x | y | Ordered Pair |
| -3 | |-3 + 1| = |-2| = 2 | (-3, 2) |
| -2 | |-2 + 1| = |-1| = 1 | (-2, 1) |
| -1 | |-1 + 1| = |0| = 0 | (-1, 0) |
| 0 | |0 + 1| = |1|= 1 | (0, 1) |
| 1 | |1 + 1| = |2| = 2 | (1, 2) |
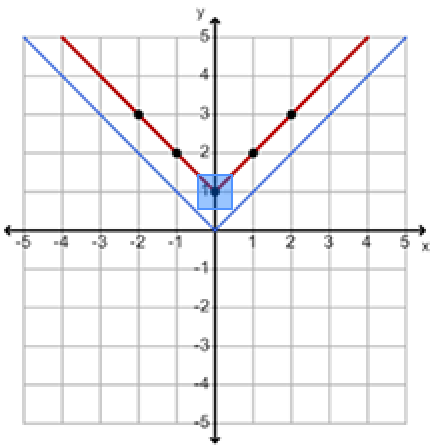
The vertex of the graph is at (-1, 0). This point is also the minimum point.
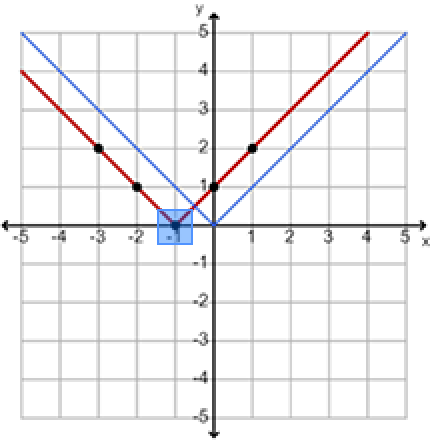
Since you have + 1 on the inside of the absolute value, your graph is translated one unit to the left from the parent function y = |x| .