What is a Step Function?
A step function is exactly as it sounds – a series of steps or stairs. This function is a piecewise function consisting of only horizontal lines, or constants.
Horizontal lines are written in the form y = a constant or
f(x) = a constant. For example, y = 4 and f(x) = -2 are two examples of constant functions.
Shipping a Package
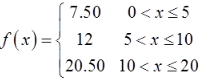
In the chart below you can see that the cost of shipping is dependent on the weight of the package.
| Cost | Weight (in lbs) |
| $7.50 | 0 < weight ≤ 5 |
| $12.00 | 5 < weight ≤ 10 |
| $20.50 | 10 < weight ≤ 20 |
You can easily graph this information as a function because it can be algebraically represented as the following function.
Graphical Representation
You can create a graphical representation using the information.
After you graph each piece of the graph, you will have something that looks like the graph below.
. 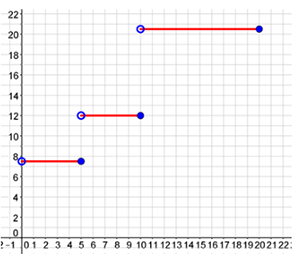
From this graph, you can see that it looks like a staircase. Which interval is the largest with regard to weight?
- 0 < x ≤ 5
- 5 < x ≤ 10
- 10 < x ≤ 20
On the graph, you notice there are several open points. These open points represent where you have only greater than instead of "or equal to" in your interval.
Example #1
Graph the step function.
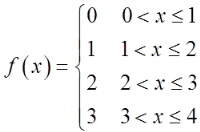
Graph the first piece. Be careful about your endpoints.
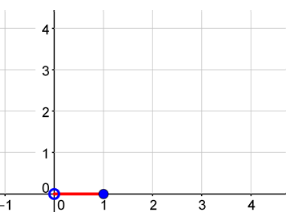
Graph the step function.
Graph the second piece. Be careful about your endpoints.
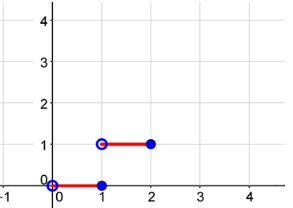
Graph the step function.
Graph the third piece. Be careful about your endpoints.
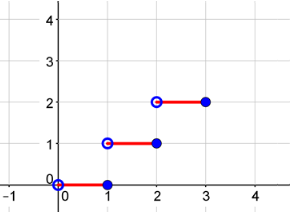
Graph the step function.
Graph the fourth piece. Be careful about your endpoints.

You now have the first four steps for the standard graph of a step function. This can be transformed in many different ways just as you did with other graphs. For this course, you will study piecewise graphs without studying their transformations.