Linear Inequalities
You have already learned about graphing inequalities in standard form, so next you'll need to learn to graph inequalities in slope-intercept form.
To graph a linear equation in slope-intercept form, recall that you will plot the y-intercept and then apply the slope (rise over run) to find the next point. This proccess also holds true for inequalities in slope-intercept form.
Example #6
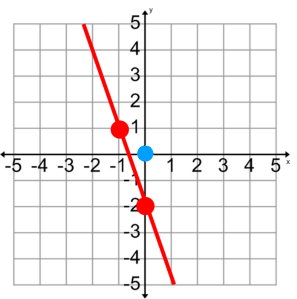
Graph y ≤ -3x – 2
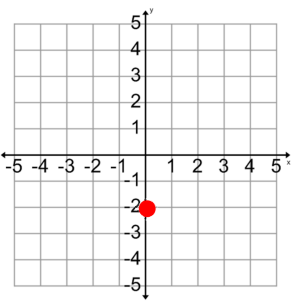
What is the y-intercept of the inequality? The y-intercept is (0,-2).
What is the slope of the line?
Rise = 3
Run = 1 to the left
Why left?
How would you plot this point?
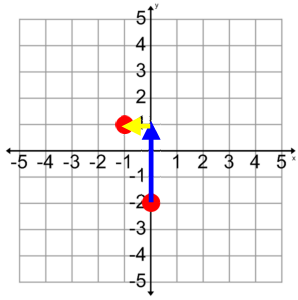
Your slope is -3/1, so you will rise three units and run 1 to the left. You will run left because your slope is negative.
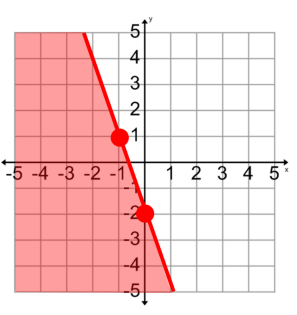
Determine if your line will be a solid line or a dotted line.
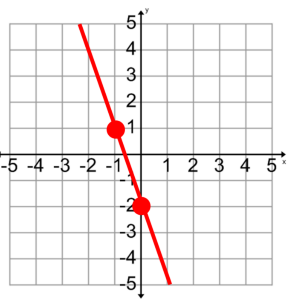
Which one and why?
Substitute a point into the original inequality to determine the shading for the graph. Substitute the point (0, 0).
0 < -3(0) - 2
0 ≤ 0 - 2
0 < - 2
0 < -2 is a false statement,
so the shading for the graph will be on the opposite side of the line from the point (0, 0).
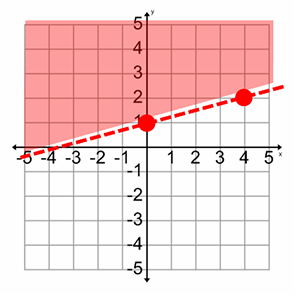
Example #4
![]()
What is the y-intercept of the inequality?
The slope of the inequality is ( / )
How would you plot the y-intercept and use the slope to plot the next point?
Will you have a solid or dotted line?
How would you draw your dotted line on the coordinate plane?
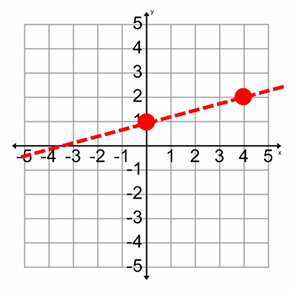
Determine the shading for your inequality.