What is a linear equation?
A linear equation has one or two variables, usually denoted by an x and a y. Linear equations will not have variables in the denominator of a fraction or variables raised to a power. Recall that the y is called the dependent variable. We call this set the range. The x is called the independent variable because the value of y is dependent upon the value of x. We call this set the domain. Let's look at a real life example of a linear equation.
Example #1
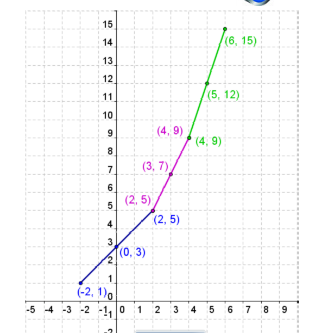
Imagine that you have a job at a local Goped sales office. You have been hired to answer the phones and take orders for the company. You will be required to work 4 hours every afternoon. You will be paid $20 per day plus you will get a $5 commission for every Goped that you sell. We can express your pay as a linear equation. Your daily pay (y) is dependent upon the number of Gopeds you sell (x). The more you sell, the more money you make. The linear equation for your daily pay is y = 5x + 20. Let's now look at your equation visually. Here is some sample data and a graph of the linear equation.
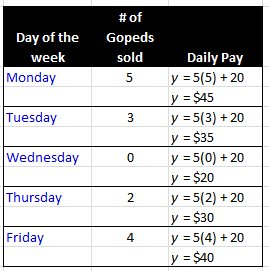
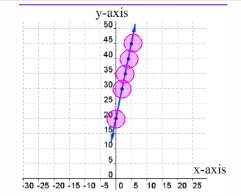
Remember, the x value is the number of Gopeds sold. Scroll over each day to see its data point. By graphing the data, we see a linear equation and we can predict other amounts, like how many Gopeds you need to sell to make $75.
Example #2
Graph 3x + 4y = 12 using the x and y intercepts and one more point.
Ok, so we need to graph this using three points. Let's start by finding the first point listed, the x intercept. To find the x intercept, plug in zero for y.
3x + 4y = 12
3x + 4(___) = 12
3x = ___
x = ___
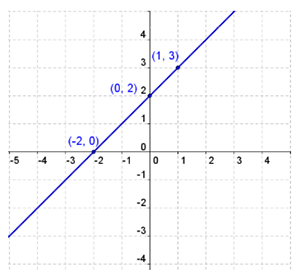
Graph 3x + 4y = 12 using the x and y intercepts and one more point.
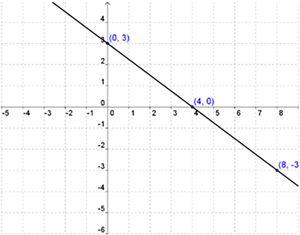
x intercept: (4,0)
Now, let's find the y intercept. To find the y intercept, plug in zero for x.
3x + 4y = 12
3 (___) + 4y = 12
4y = 12
y = ___
Graph 3x + 4y = 12 using the x and y intercepts and one more point.
x intercept: (4,0) y intercept: (0,3)
We need one more point for our line. We can use any point we like. Plug in values for x and slove for y or vice versa. I plugged in -3 for y.
3x + 4y = 12
3x + 4(___) = 12
3x + ___ = 12
3x = ____
x = ____
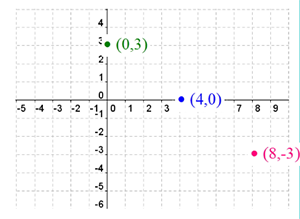
Our three ordered pairs plotted on a graph are: (4,0), (0,3), and (8, -3).
Watch the video solution here
Graphs with Constraints
Remember the word constraints? Some graphs that have constraints are called piece-wise graphs. They are "pieced" together like the following example. The condition on these graphs is the domain beside each equation. The equation can only be graphed on the interval of the given domain. Think about how you would graph the following:
GRAPH:
y = x + 3 -2 ≤ x ≥ 2
y = 2x + 1 2 < x ≤ 4
y = 3x - 3 4 < x ≤ 6
Example #3
Look at the constraints again. If you are substituting values into the equation for x to solve for y, what x values can you use?
y = x + 3 | -2 ≤ x ≤ 2 We can only use numbers from -2 to 2
y = 2x + 1 | 2 < x ≤ 4 We can only use numbers between 2 and 4
y = 3x - 3 | 4 < x ≤ 6 We can only use numbers between 4 and 6
Now, in each of these domains, substitute in values of x to solve for y so we can graph.
y = x + 3 | -2 ≤ x ≤ 2
Make an x|y chart
| x | y |
| -2 | |
| 0 | |
| 2 |
y = 2x + 1 | 2 < x ≤ 4
Make an x|y chart
| x | y |
| 2 | |
| 3 | |
| 4 |
y = 3x - 3 | 4 < x ≤ 6
Make an x|y chart
| x | y |
| 4 | |
| 5 | |
| 6 |
How would you graph the points and draw the line?
Watch the video solution here
Graphing Inequalities
Remember graphing inequalities on a number line - we marked our reference points as open or closed and then shaded in one direction. Graphing linear inequalities is done in a similar manner.
To graph y ≤ x - 2, we first graph a boundary line and then shade to one side. The boundary line is the line you would get if you changed the inequality sign to an equal sign and made an xly chart. The boundary line will be solid for ≥ and ≤. The boundary line will be a dashed line for < and >. To decide which way to shade, we choose a point not on the line and evaluate the inequality. If it is a true statement, we shaded that side. If it is a false statement, we shade the other side.
Example #4
Graph y ≤ x + 2
Make an x|y chart for y = x + 2
| x | y |
| -2 | |
| 0 | |
| 1 |
How would you plot these points on the coordinate plane and connect the points?
Since this a less than or equal to problem, not a less than problem, use a solid line.
Choose a point not on the line (0,0) and plug into the inequality to determine which side to shade.
y ≤ x + 2
≤ + 2
≤
Is this statement true or false?
Watch the video solution here
Example #5
Graph: y > 2x + 1
Make an x|y chart for y = 2x +1
| x | y |
| 2 | |
| 0 | |
| 1 |
Plot these points on the coordinate plane and connect.
Use a dashed line since this a </> problem.
Choose a point not on the line (0,0) and plug into the inequality.
y > 2x + 1
> 2() + 1
>
Is this statement true or false?
Watch the video solution here