"And" Inequalities
You have learned about “or” compound inequalities. In this lesson, you will learn about “and” compound inequalities.
AND compound inequalities are inequalities which have two parts and the solutions will occur between two given values. They can be written with the word and or as one string of two inequalities.
AND inequalities could appear as:
2x - 5 > -15 and 3x < 12 or -24 < 3x + 3 ≤ 15
Graphing Compound Inequalities
The graph of an AND inequality will be the intersection between two graphs; meaning, you will graph the overlapping part of the graph.
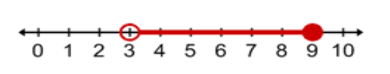
If you were given the graphs below:

Their intersection would have a left endpoint at -4 and right endpoind at 2. Your final graph would be the intersection of these two graphs.
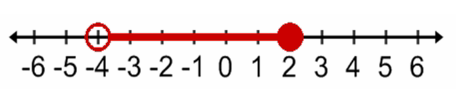
Note: -4 would be an open point because it is not shaded in both graphs. The top graph has an open point at -4 and the bottom graph is shaded over -4. The value 2 would be a closed point because it is included in both graphs.
Example #6
Graph the inequality -5 ≤ m ≤ 1
This inequality can be split into two separate inequalities: -5 ≤ m and m ≤ 1
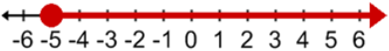
The symmetric property can be applied to the first inequality to obtain m ≥ -5
And if you were to graph this inequality, you would have:
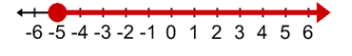
Graph the inequality -5 ≤ m ≤ 1
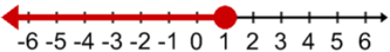
If you were to graph the second inequality, m ≤ 1 your graph would look like:
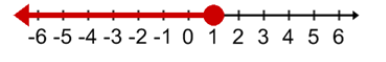
Graph the inequality: -5 ≤ m ≤ 1
To graph the compound inequality, you would graph the intersection of these two graphs.
What is the left endpoint of your graph?
What is the right endpoint for your graph?
To graph the compound inequality, you would graph the intersection of these two graphs.
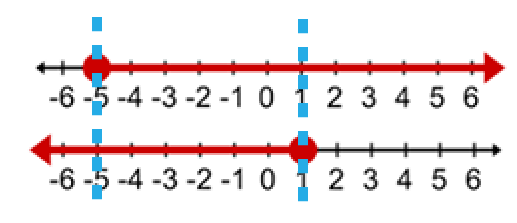
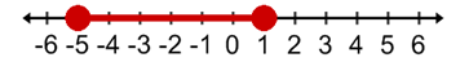
The blue lines show the intersection of the two graphs so the graph of the compound inequality is:
Example #7
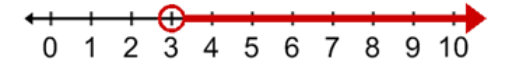
3 < m ≤ 9
To graph the first inequality, apply the symmetric property to rewrite the inequality as m > 3 and graph this inequality.
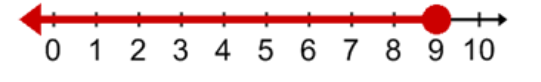
Then, graph the second inequality, m ≤ 9
What is the correct way to graph this compound inequality?
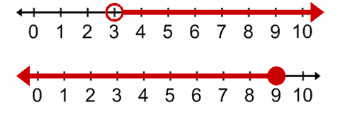
Answer: