Learn
Cosecant
Recall the Graph of Sine
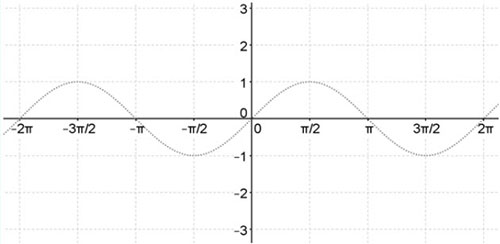
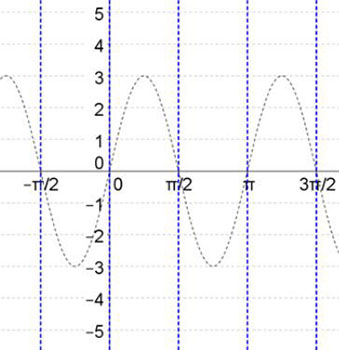
We will look at the graph of cosecant first. Remember that cosecant will be undefined at the locations around the unit circle where sin(x) = 0.
To examine the graph of cosecant, recall the graph of sine. The graph of sine is the gray dotted curve.
Graph of Cosecant
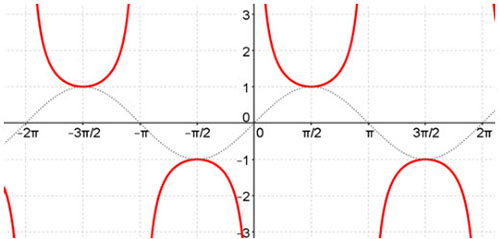
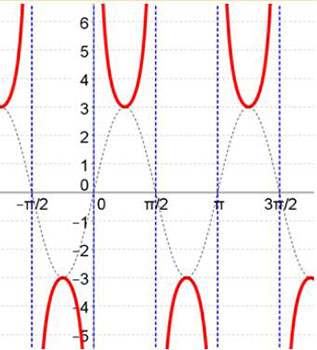
Now that we have the graph of sine, let's look at the standard graph of cosecant which is the red curve below. Remember sine will always be less than zero. Therefore, since cosecant is the reciprocal of sine, it will always be greater than 1. As the value of sin(x) approaches zero, the value of cosecant, its reciprocal, will become larger and larger.
Asymptotes of Cosecant
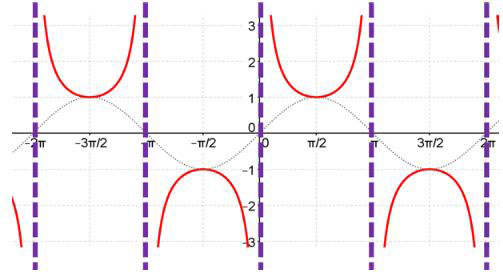
You will notice there are breaks in the graph. The breaks are where sin(x) = 0 which makes cosecant undefined. These breaks will be asymptotes.
Where do the asymptotes occur? List all of the locations where sin(x) = 0.
Characteristics of Cosecant
- Amplitude
- Recall from previous lessons that amplitude is defined as the height of a graph from the midline to the maximum point. You will notice that cosecant does not have a maximum point. Therefore, the amplitude will be undefined.
- Midline
- The midline of the graph of cosecant will still be the constant of the function. The midline will be halfway between each relative maximum and minimum point for cosecant. The midline for csc(x) is y = 0.
- Period
- The period of the function is a little different from that of tangent and cotangent. If you go between two asymptotes, you only get one half of the graph. Instead, count between three asymptotes - containing a downward portion and an upward portion - to get the full cycle. The period of the graph y = csc(x) is 2π.
Cosecant Transformations
Standard Form of Cosecant
Let's look at the basic characteristics of cosecant.
y = A csc(Bx + C) + D. Let's label what each coefficient controls.
- A is the coefficient which changes the relative maximum and minimum points for the graph. This is also the distance from the midline.
- B is the coefficient which changes the asymptotes of the graph.
- C is the value which shifts the graph left or right. If you have a "+", you will shift to the left. If you have a "−", you will shift to the right.
- D is the midline of the graph.
The period of the cosecant graph is defined by 
To find the horizontal shift of the graph, use the formula 
Example #1
Graph the equation y = 3csc(2x)
- Period and Midline
- The period is found by applying the formula = 2.
- So the period is found by
 which simplifies to π.
 - Next, we want to look at the distance the maximum and minimum points will be from the midline of the graph. Since A = 3, we will have a distance of 3 units from the midline to each maximum and minimum point on the graph.
- The period is found by applying the formula
- Graph y = 3sin(2x)
- Let's look at the graph of y = 3csc(2x).
- To draw this graph, we will want to sketch the graph of y = 3sin(2x) to help us.
- In the graph, you can see the dotted line represents the graph of y = 3sin(2x).
- Asymptotes
- Next, we will draw our asymptotes for the graph of y = 3csc(2x).
- Note that we draw our asymptotes where y = 0 for y = sin(2x).
- Graph y = 3csc(2x)
- Finally, to draw the graph of y = 3csc(2x), we will use the maximum and minimum points for the graph of y = 3csc(2x) to find the relative minimum and maximums of y = 3csc(2x).
Example #2
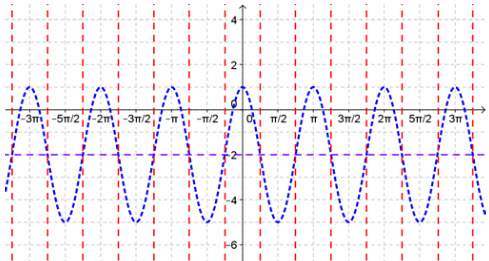
Graph the equation y = 2csc(4x) + 2
The period is found by applying the formula
What is the period for the graph?  =
=
The vertical shift is equivalent to the D value.
What is the vertical shift for this graph?
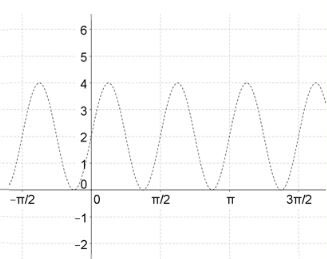
We will graph this function by drawing the graph of y = 2sin(4x) + 2 first.
Let's break this down.
- A is 2, so the sin graph will have an amplitude of 2.
- B is 4, so the sin graph will have a period of
 or
or  .
. - D is 2, so the midline is y = 2. That means the entire graph goes through one full cycle between 0 and 2π. It will start at (0, 2) since the midline is y = 2 and will have a maximum and minimum of (
 , 4) and (
 , 0).
, 0).
Next, we want to draw our asymptotes. Draw vertical lines for your asymptotes on the graph of y = 2sin(4x) + 2. Also, draw the midline on the graph.
Remember the asymptotes here will be where the graph intercepts the midline.
Lastly, draw your graph of cosecant using the maximum and minimum points of the corresponding sine curve.
Example #3
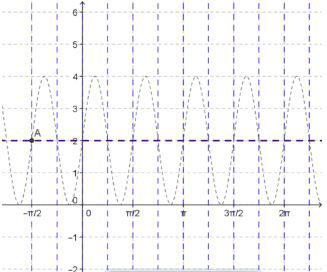
Consider the graph below. What is the equation of the graph in red? The graph of the new equation is the red curve and the graph of cosecant is the dotted grey curve.
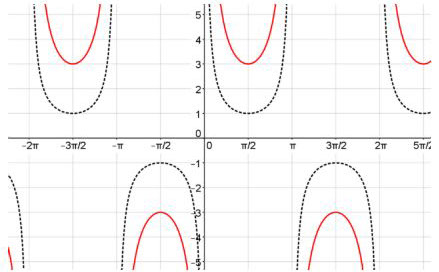
To write the equation of the graph, begin by finding the value of A. Determine how far the new graph is from the midline. A = 3
Our asymptotes are at x = 0 and x = 2π, so our period is 2π.
The graph is 3 units away from the midline, so A = 3. The period of the function is 2π. Use this to find B.

We can put all of this together to find the equation of the graph. Because the graph did not shift up, down, left, or right, there will be no values for C or D. Fill-in the parts of the equation below.
y = A csc(Bx + C) + D
Secant
Lastly, we will work with the graph of secant (sec).
Remember that secant will be undefined at the locations around the unit circle where cos(x) = 0.
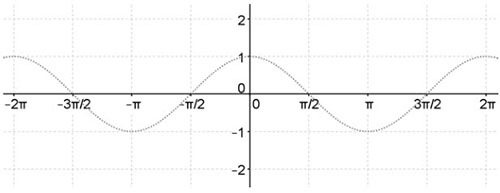
As with cosecant, we will first graph cos(x) first to reference while we examine the graph of secant. the graph of cos(x) is the grey curve below.
Graph of Secant
Now that we have the graph of cosine, let's look at the standard graph of secant which is the red curve below.
Remember, the range of cosine is [−1, 1].
Therefore, since secant is the reciprocal of cosine, it will always be greater than 1.
As the value of cos(x) approaches zero, the value of secant, its reciprocal, will become larger and larger.
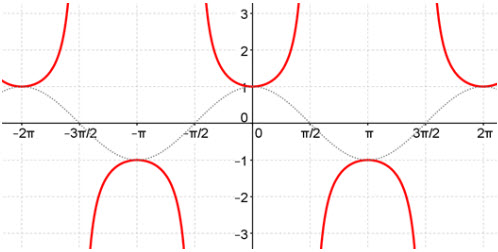
Asymptotes of Secant
You will notice there are breaks in the graph. The breaks are where cos(x) = 0 which makes secant undefined. These breaks will be asymptotes.
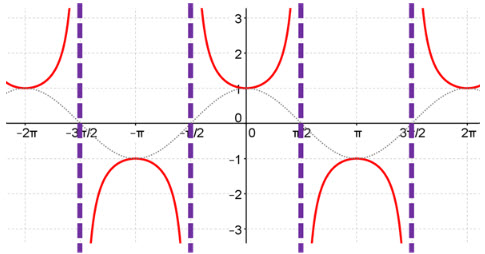
Where do the asymptotes occur? List all of the locations where cos(x) = 0.
So, we have asymptotes at x =  , ,
, ,  and for our graph as this is where cos(x) = 0.
Characteristics of Secant
- Amplitude
- Recall from previous lessons that amplitude is defined as the height of a graph from the midline to the maximum point. You will notice that secant does not have a maximum point. Therefore, the amplitude will be undefined. However, the relative minimum for sec(x) = 1 and the relative maximum for sec(x) = −1.
- Midline
- The midline of the graph of secant will still be the constant of the function. The midline will be halfway between each relative maximum and minimum point for secant. The midline is y = 0.
- Period
- The period of the function is the distance between the asymptotes containing one full cycle of the graph. The period is 2π.
Secant Transformations
Standard Form of Cosecant
Next, let's look at the standard equation of secant.
Given y = A sec(Bx + C) + D, then we have the following:
- A is the coefficient which changes the relative maximum and minimum points for the graph. This is also the distance from the midline.
- B is the coefficient which changes the repetitions and asymptotes of the graph.
- C is the value which shifts the graph left or right. If you have a "+", you will shift to the left. If you have a "−", you will shift to the right.
- D is the value which shifts the graph up or down. If you have a "+", you will shift up. If you have a "−", you will shift down.
The period of the cosecant graph is defined by
Example #4
Graph the equation y = 3sec (2x) − 2.
Let's start by determining some characteristics of the graph.
The period is found by applying the formula
What is the period for the graph?
The vertical shift is equivalent to the D value. What is the vertical shift for this graph? units down
We will start by graphing y = 3cos(2x) − 2 first. Graph y = 3cos(2x) − 2. Also draw the midline and asymptotes where cos(x) = 0.
Now, using the maximum and minimum points equation of y = 3cos(2x) − 2, graph y = 3sec(2x) − 2.