Introduction
Graphs of Logarithms
Graphing expnential funcitons and logarithmic functions is easy because they are both functions!
Remember, to test to see if a graph is a function, the vertical line test is used.
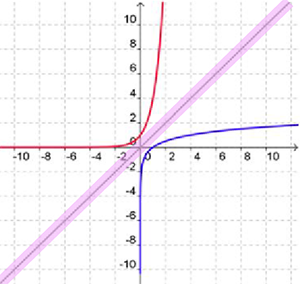
The example here is the graph of both the exponential function y = 4x and the logarithmic function y = log4 x, which written in exponential form is 4y = x.
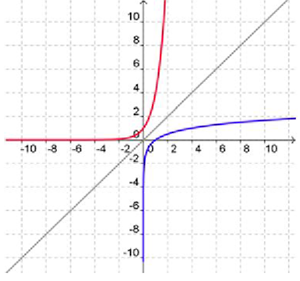
What do you notice about the two graphs?
Hint: Look at the line y = x.