Learn
Growth and Decay
Exponential Growth Function
First, let's look at the function
f(x) = bx
where b > 1. Notice the x is in exponent and b is the base which can take on any values greater than one.
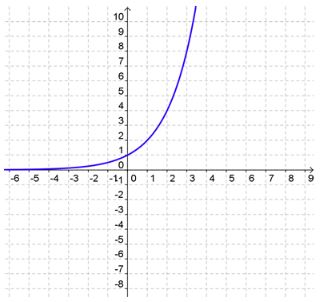
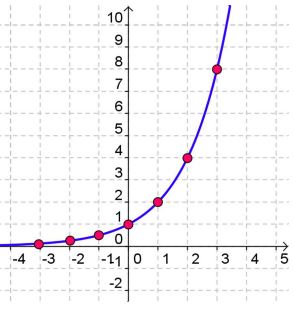
Here is a table of values and a graph of the function f(x) = 2x
| x | y = 2x |
|---|---|
| -3 | 2-3 =  |
| -2 | 2-2 =  |
| -1 | 2-1 =  |
| 0 | 20 = 1 |
| 1 | 21 = 2 |
| 2 | 22 = 4 |
| 3 | 23 = 8 |
This is also called an exponential growth function because the values for y are getting larger exponentially.
Let's look at the graph of the function f(x) = 2x
Exponential Decay Function
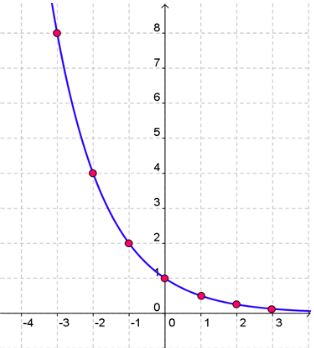
Let's look at the function f(x) = bx where 0 < b < 1.
Notice that the base takes on the values of fractions between zero and one.
Here is a table of values. This is also called an exponential decay function because the values for y are getting smaller exponentially.
| x | y = 2x |
|---|---|
| -3 |  = 8 = 8 |
| -2 |  = 4 = 4 |
| -1 |  = 2 = 2 |
| 0 |  = 1 = 1 |
| 1 |  = = |
| 2 |  = = |
| 3 |  = = |
Let's look at the graph of the function 
Exponential Family
We are introducing a new family of functions to our community - the exponential function family.
Use the Family of Functions spreadsheet you have been provided. By the end of this lesson, you should be able to complete the spreadsheet for exponential functions.
Exponential Equations
For the quadratic function, we have f(x) = (x - h)2 + k
For the absolute value function, we have f(x) = |x - h|2 + k
So for our new exponential functions, we have f(x) = b(x - h) + k
f(x) = b(x - h) + k
Notice the variable is in the exponent. This is the case with all exponential functions.
Exponential Graph and its Properties
Study the exponential graph. What is the equation of this graph?
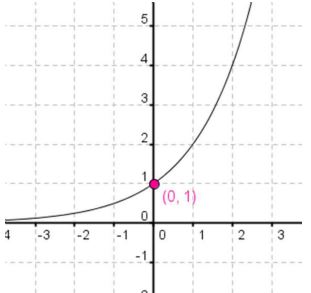
y = x
Notice that the graph gets very close to the x-axis but never actually reaches it. The x-axis (y = 0) is an asymptote.
Many of our graphs have the y-intercept at the origin, but the exponential graph has the y intercept at ( , )
The domain is all real numbers. The range is y > 0.
Let's also talk about the end behavior. End behavior is what the graph is doing at positive and negative infinity.
At negative infinity, the graph is approaching y = 0.
At positive infinity, the graph approaches infinity.
Translations
Now try this.
Use GeoGebra: Exponential Function Translation to complete the chart in your notebook by comparing each new graph and equation to the parent, f(x) = bx.
Here's the first one.
| h | k | Slide | New (0, 1) | New Equation |
|---|---|---|---|---|
| 2 | -3 | Right 2, down 3 | (2, -2) | y = 2(x - 2) - 3 |
Fill in using three more h and k values. Use the same signs as well as different; however, for our purpose keep h not equal to k.
Equation
Look at f(x) = b(x - h) + k
The h is grouped with the x whether the parentheses are present or not and presents translations on the x-axis, left and right.
The k is not grouped with x and represents translations on the y-axis, up and down.
Example #1
Visualize what the graph and equation should look like before sketching it.
f(x) = 2(x + 2) + 3
First, ask yourself...
What is the parent function?
Is the 2 translation left or right?
Is the translation up or down?
Sketch the curve.
What is the new asymptote? y =
Name the domain and range.
The domain is all real numbers and the range is y >
Name the intercepts:
x-intercept:
y-intercept:
Example #2
Graph: f(x) = 3(x + 1) - 5
What is the parent function?
What is the base?
What does the negative in front of the x do? Flips the graph over the axis?
What does the -5 do? Translates the graph 5 units
What does the 1 do? Translates the graph 1 unit
Answer the questions below and then sketch the graph. Flipped over y axis, 5 down, 1 left.
Sketch the curve.
What is the new asymptote?
y =
Describe the end behavior.
At negative infinity the graph approaches positive infinity. At positive infinity the graph approaches.
Example #3
Graph: y = -2x - 3
Complete the sentences for each transformation in the graph and then graph it.
The negative in front of the 2 in this exponential equation flips the entire graph over the axis.
The -3 in the equation translates the graph spaces .
Sketch the curve.
What is the new asymptote and the y-intercept.
y = and ( )
What is the domain and range?
The domain is all real numbers and the range is y <
x-intercept:
y-intercept:
Solving Exponential Equations Graphically
Suppose we have the exponential equation: 4x = 16
We can actually solve this by graphing. Make a system of equations, in other words make two equations out of this problem. Set y to the left side and set y equal to the right side.
y = 4x
y = 16
Graph both on the same coordinate plane. Use a graphing calculator or GeoGebra.
In a system, the solution is where the two equations intersect.
Where do the two equations appear to intersect?
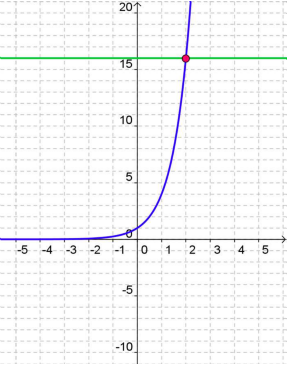
x = 2
We can actually verify whether or not this is the answer. Take the original equation and plug in 2 for x.
4x = 16
42
= 16
16 = 16
Example #4
Solve 4x + 3 = 25x by graphing and verify your answer is correct.
Step 1: Make a system
y = 4x +3
y =
25x
Step 2: Graph both on the same coordinate plane. Use a graphing calculator or GeoGebra. Keep changing the range until you see the intersection.
My first graph looked like this:
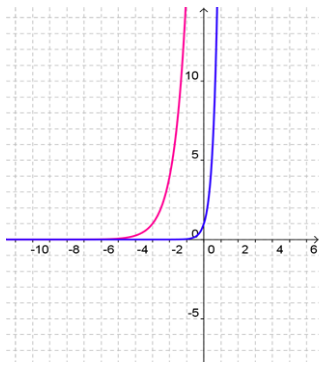
Several adjustments to the range are needed...
By changing the scale, then intersecting the two curves, I found my answer, x = 2.
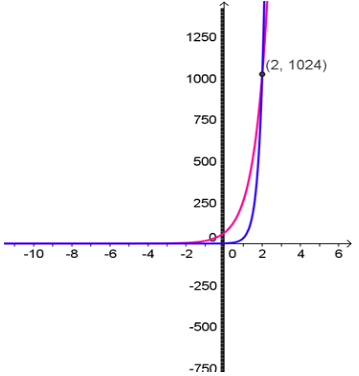
Verify: Take the original equation and plug in 2 for x.
4x + 3 = 25x
42 + 3 = 25(2)
45 = 210
1024 = 1024