Learn
Sketching Graphs
Steps to Sketch a Graph of a Polynomial
- Step 1 Find the x-intercepts: set each factor equal to zero and solve.
- Step 2 Mark each x-intercept on the x-axis. Do not number the y-axis.
- Step 3 Find the relative maximum and/or the relative minimum between each x-intercept.
- Step 4 Sketch the graph.
Example #1
Watch Sketch the Graph of a Polynomial Function.
Open Sketch the Graph of a Polynomial Function in a new window
Note: The presentation may take a moment to load.
Example #2
Watch Sketch the Graph of a Polynomial Function.
Open Sketch the Graph of a Polynomial Function in a new window
Note: The presentation may take a moment to load.
Steps for Finding Rational Roots and/or Factors
Here are the steps for finding Rational Roots and/or Factors, Graphs:
- Write all the factors of the first and last terms of the polynomial.
- Write all the possible rational roots by making fractions where the numerator is a factor of the last term and the denominator is a factor of the first term,

- List P () in order from smallest to largest.
- Evaluate all.
- Choose zeros/roots.
- Write factors (when asked to).
- Graph (when asked to).
Example #3
Watch Sketch the Graph of a Polynomial Function.
Open Sketch the Graph of a Polynomial Function in a new window
Note: The presentation may take a moment to load.
Use a Graphing Tool
So far, we have found the roots of polynomial functions or equations by using the Remainder Theorem or by using synthetic division. However, these methods only work when our roots are rational.
What do we do when we can't find the roots using these methods but we can clearly see a graph crosses the x-axis (in other words, has real roots)?
If the roots of a polynomial function or equation are irrational, we will need the help of a graphing utility. We might use our graphing calculator or we might use a computer program such as Geogebra to help us find the roots. Let's start by using a graphing calculator.
Example #4
Calculator
Watch Find the Roots of a Polynomial Function Using a Graphing Tool.
Open Find the Roots of a Polynomial Function Using a Graphing Tool 1 in a new window
Note: The presentation may take a moment to load.
GeoGebra
Open Find the Roots of a Polynomial Function Using a Graphing Tool 2 in a new window
Note: The presentation may take a moment to load.
Example #5
Sketch the graph of f(x) = 2x3 − x2 − 15x − 10
First, how many solutions do we expect to find?
Hint: It is the leading degree.
Answer: 3
At most, how many x-intercepts do we expect to have?
Hint: It is the same as the leading degree.
Answer: 3
At most, how many turning points do we expect to have?
Hint: 1 less than the leading degree.
Answer: 2
What will the end behavior be for this graph? Starts ___blank and ends ___blank.
Hint: It is a positive odd function.
Answer: Starts down and ends up.
Now, first look to see if this will factor.
It will not factor. You can try to factor by grouping, but it will not work. So, we need to find the factors of our p and q now.
Factors of 10: ±1, ±2, ±5, ±10
Factors of 2: ±1, ±2
Example #5 List Combinations
List all combinations of the factors of 10 divided by the factors of 2
±1, ![]() , ±2, ±5,
, ±2, ±5, ![]() , ±10
, ±10
Now, list them in order from least to greatest and evaluate.
- f(− 10) = − 1960
- f(− 5) = − 210
- f(
 ) = − 10
 - f(− 2) = 0
- f(− 1) = 2
- f(
 ) = − 3
 - f(
 ) = − 17.5
 - f(1) = − 24
- f(2) = − 28
- f(
 ) = −22.5
 - f(5) = 140
- f(10) = 1740
x = −2 is the only rational solution. The other two solutions will be either be either irrational or imaginary.
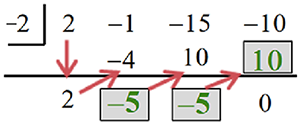
Example #5 Use Synthetic Division
We are missing 2 solutions. They will either be irrational or imaginary. We can use synthetic division using −2 to find the other solutions.
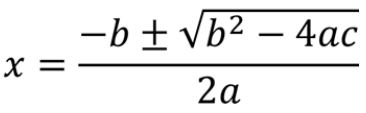
Example #5 Use the Quadratic Equation
We will find the other solutions by solving this equation.
2x2 − 5x − 5 = 0
Since this is a quadratic formula, we can solve it by using the quadratic equation. Identify the a, b, and c.
- a = 2
- b = −5
- c = −5
 =
= 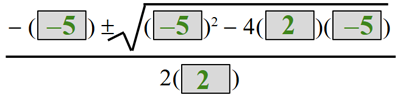
![]() =
= ![]()
The zeros of this function are −2, ![]()
Example #5 Find Points
To find points between the three x-intercepts, we need to find the decimals of the two irrational zeros.
![]() ≈ 3.27.
≈ 3.27.
![]() ≈ −0.77
≈ −0.77
To find a point halfway between −0.77 and −2, add them and divide by 2. We get −1.39. Next, find f(–1.39).
f(–1.39) = 2(−1.39)3 − (−1.39)2 − 15(−1.39) − 10 = 3.55 (−1.39, 3.55) is a point between −0.77 and −2.
Find a point halfway between –0.77 and 3.27. It will be 1.25. Find f(1.25).
f(1.25) = 2(1.25)3−(1.25)2 − 15(1.25) − 10 = −26.41
(1.25, −26.41) is a point between −.077 and 3.27.
- (−1.39, 3.55) is a point between −0.77 and −2.
- (1.25, −26.41) is a point between −0.77 and 3.27.
- We can find the y-intercept by putting 0 in for x.
- 2(0)3 − (0)2 − 15(0) − 10 = −10
- The y-intercept is −10.
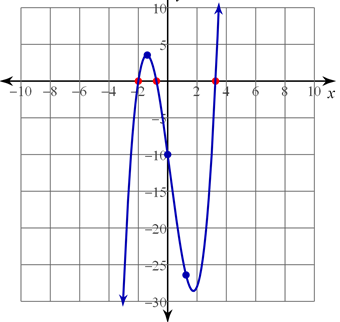
Example #5 Complete the Graph
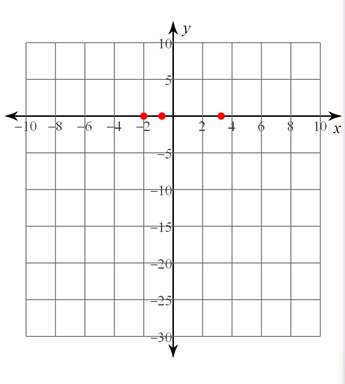
- Let's begin by plotting our x-intercepts
- Next, we can plot our other points that we found and the y-intercept.
- (−1.39, 3.55)
- (1.25, −26.41)
- The y-intercept is −10.
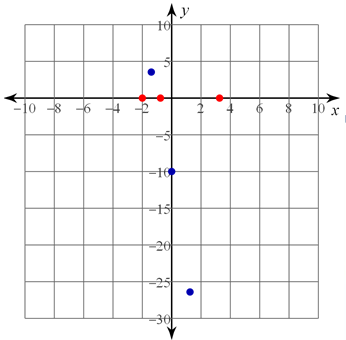
We stated in the beginning that this is a positive odd function, so the graph will start down and end up. We can now draw the curve through the points to complete the graph.