Learn
Applications of Quadratic Functions
There are many, many different useful applications for quadratic equations. The best examples are problems which involve something going up and then falling down (for example, a ball or a roller coaster.)
A more difficult quadratic application problem could be determining the cost and break-even point for a company.
In this lesson, you will encounter several of the easy problems and some of the more difficult ones.
Example #1
Watch Interpret Expressions that Represent a Quantity in Terms of Its Content.
Open Interpret Expressions that Represent a Quantity in Terms of Its Content in a new window
Note: The presentation may take a moment to load.
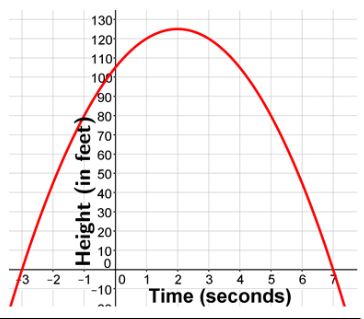
An object is thrown upwards from the window of a office tower with an initial velocity of 20 meters per second. Its height, h (in meters) at any time, t, in seconds can be approximated by the equation h(t) = −5t2 + 20t + 105.
From the graph, you can gather all of the following information:
The object was thrown from 105 feet in the air. After 2 seconds, it reaches its maximum height of 125 feet. The ball reaches the ground after 7 seconds.
Suppose you were asked to predict the height of the object after 4.5 seconds.
To do this, because t represents time and you want to determine a certain point given a certain time, substitute this value for t and simplify.
Predict the height of the object after 4.5 seconds. Substitute t = 4.5 into the equation.
- h(t)= −5t2 + 20t + 105
- h(4.5) = −5(4.5)2 + 20(4.5) + 105
- h(4.5)=−5(20.25) + 90 + 105
- h(4.5) = −101.25 + 90 + 105
- h(4.5) = 93.75 feet
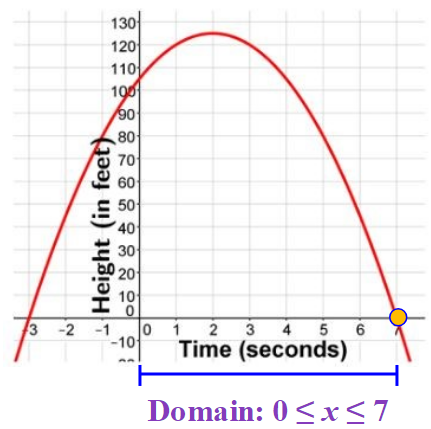
Example #1 Determine the Domain
The domain is the x-values which in this problem is t and represents time.
Can time be negative?
What will the domain have to start at?
What is the farthest point on the graph going to the right?
It is the x-intercept. We have already found this earlier. It was 7.
So, the domain is between
We write this using
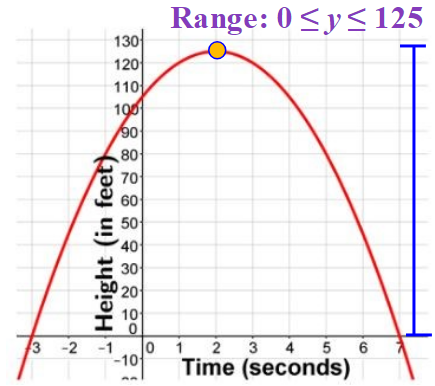
Example #1 Determine the Range
The range is the y-values which in this problem is h(t) and represents height.
Can height be negative?
What will the height have to start at?
What is the highest point on the graph?
It is the y of the vertex. We have already found this earlier. It was 125 feet.
So, the range is between
We write this using:
Example #2
Watch Create Quadratic Equations to Maximize the Area of Rectangular Regions.
Open Create Quadratic Equations to Maximize the Area of Rectangular Regions in a new window
Note: The presentation may take a moment to load.
Example #3
Watch Create Quadratic Equations and Use Them to Model and Solve Real-World Problems.
Open Create Quadratic Equations and Use Them to Model and Solve Real-World Problems in a new window
Note: The presentation may take a moment to load.