Learn
Properties
What is a Quadratic Function?
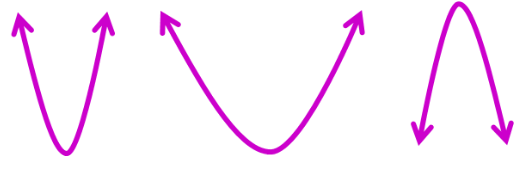
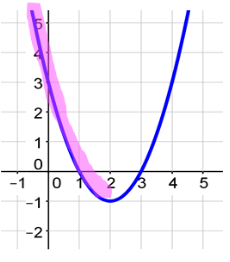
A Quadratic Function is an equation where each x-value corresponds to only one y-value. The graph will appear as a "U" shaped graph. The graph is called a parabola. The parabolas below are examples of quadratic functions.
Hint: Remember that function notation is f(x) and the graph of an equation us y =. These two are interchangable and you will see both during this unit.
Key Properties of Graphs
The graph of a quadratic function may appear simple, but there are many different properties to the graph. The following is a list of the properties which you will study during this lesson:
- Positive or Negative Parabola
- Vertex of the Parabola
- Axis of Symmetry
- Maximum and Minimum Values
- Intervals of Increasing and Decreasing
- x-intercept(s)
- y-intercept
Positive or Negative Parabola
The standard form of a parabola, or quadratic equation, is:
y = ax2 + bx + c
If the value of a is greater than zero, the parabola will open up and will be a positive parabola.

If the value of a is less than zero, the parabola will open down and will be a negative parabola.

The Vertex of a Quadratic
The graph below is a positive quadratic function.
The next property to identify is the vertex of the function. The vertex can be thought of as the turning point of the graph.

The Axis of Symmetry of a Quadratic
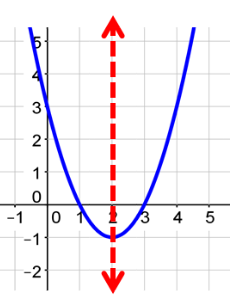
The graph below is a positive quadratic function.
The axis of symmetry is the vertical line that passes through the vertex. If you were to draw this graph on a piece of paper and fold along the axis of symmetry, each side of the graph would align.
Maximum and Minimum Values
The graph below is a positive quadratic function.
The minimum value of a quadratic is the lowest point on the graph. The minimum value is the same coordinate as the vertex of the function. You will have a minimum value if your graph opens up, or in other words, is positive.
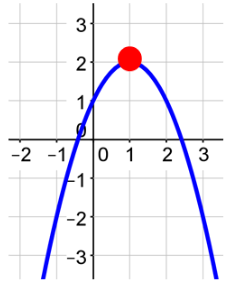
The graph below is a negative quadratic function.
The maximum value of a quadratic is the highest point on the graph. The maximum value is the same coordinate as the vertex of the function. You will have a maximum value if your graph opens down, or in other words, is negative.
Increasing Interval of a Quadratic
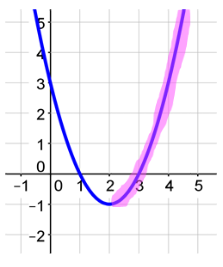
The graph below is a positive quadratic function.
The interval where the graph is increasing occurs where the graph appears to be climbing uphill.
Decreasing Interval of a Quadratic
The graph below is a positive quadratic function.
The interval where the graph is decreasing occurs where the graph appears to be falling downhill.
The x-intercepts
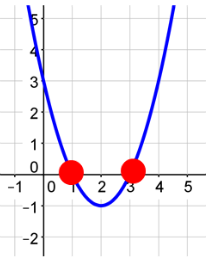
The graph below is a positive quadratic function.
The x-intercepts of the graph are the intersections of the graph and the x-axis. The x-intercepts play an important role in the solution to the equation of the quadratic. Quadratic functions will have zero, one, or two x-intercepts.
The y-Intercepts
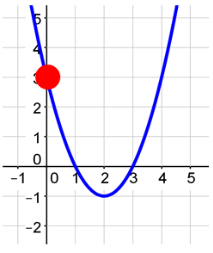
The graph below is a positive quadratic function.
The y-intercept of the graph is the intersection of the graph and the y-axis. The y-intercept will also be the constant term of the function. Quadratic functions will have one y-intercept.
Example #1
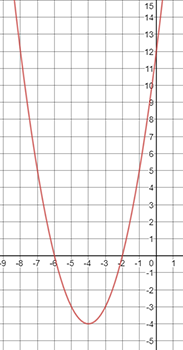
The graph below is f(x) = x2 + 8x + 12. Identify the key features of the graph.
Is this a positive or negative parabola?
Answer: This is a positive parabola because it is opening up. You also know this is a positive parabola because the value of a is 1 which is greater than 0.
What is the vertex of the function?
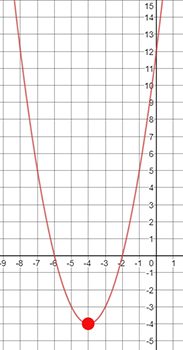
( ___blank , ___blank )
Answer: (−4, −4)
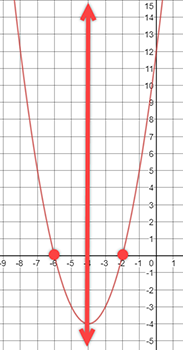
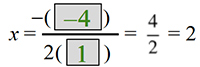
What is the equation for the axis of symmetry?
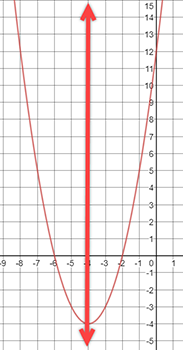
x = ___blank
Answer: x = −4
What is the maximum or minimum point for the graph? Because this graph opens up, you will only have a minimum value. The minimum value occurs at the vertex. The minimum value is the same as the vertex, (−4, −4).
Where is the graph increasing?
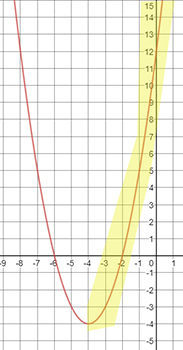
The graph begins increasing at an x-value of −4 and continues to the right indefinitely. The interval will be (−4, ∞). Hint! Always remember that graphs continue indefinitely to the left and to the right. When indicating "indefinitely" in math terms, you will use the infinity symbol (∞). You can have one of two possibilities for your intervals of increasing and decreasing: (x, ∞) or (−∞, x). x represents the x-coordinate of the vertex.
Where is the graph decreasing?
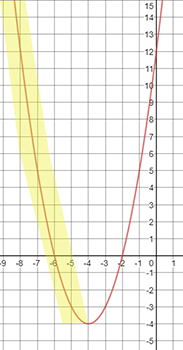
The graph begins decreasing at an indefinite x-value and continues to an x-value of −4. The interval will be (-∞, −4).
What are the x-intercepts of the graph?
( __ , 0) ( __ , 0)
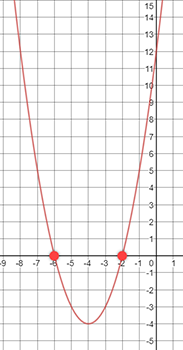
Answer:
(−6, 0)
(−2, 0)
What is the y-intercept of the graph? (0, ___blank )

Answer: (0, 12)
The graph below is f(x) = x2 + 8x + 12.
Summary of Key Features:
- Positive Parabola
- Vertex: (−4, −4)
- Axis of Symmetry: x = −4
- Increasing: (−4, ∞ )
- Decreasing: (−∞ , −4)
- Minimum Value: (−4, −4)
- x-intercepts: (−6, 0) and (−2, 0)
- y-intercept: (0, 12)
Example #2
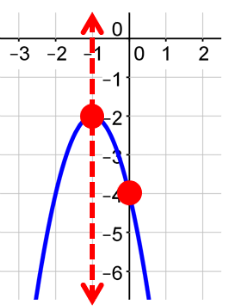
The function is graphed below f(x) = −2x2 − 4x −4. Identify the key features of the graph. Is this a positive or negative parabola?
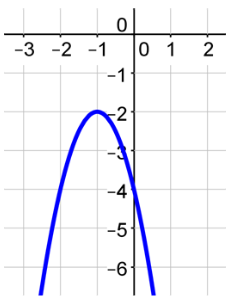
Answer: This is a negative parabola because it is opening down. You also know this is a negative parabola because the value of a is −2 which is less than 0.
What is the vertex of the function?
(___blank, ___blank)
Answer: (−1, −2)
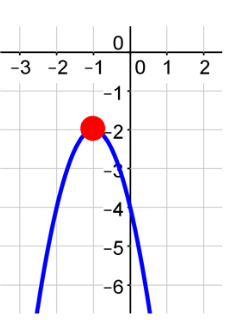
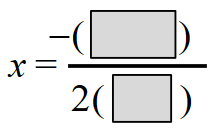
What is the equation for the Axis of Symmetry?
x = ___blank
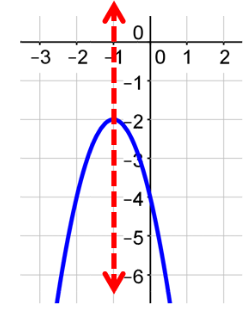
Answer: x = −1
What is the maximum or minimum point for the graph? Because this graph opens down, you will only have a maximum value. The maximum value occurs at the vertex. The maximum value is (−1, −2).
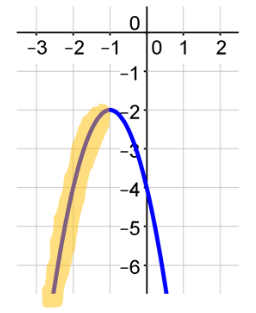
Where is the graph increasing?
The graph begins increasing at an indefinite x-value and continues to an x-value of −1. The interval will be (-∞ , −1).
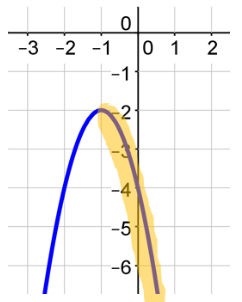
Where is the graph decreasing? The graph begins decreasing at an x-value of −1 and continues to the right indefinitely. The interval will be (−1, ∞ ).
What are the x-intercepts of the graph? There are no x-intercepts to this graph because the graph does not intersect the x-axis.
What is the y-intercept of the graph?
(0, ___blank )
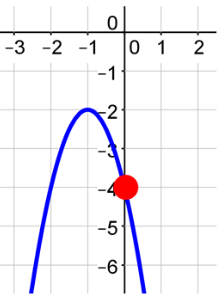
Answer: (0, −4)
The graph below is the graph of f(x) = −2x2 − 4x − 4.
Summary of the Key Features
- Negative Parabola
- Vertex: (−1, −2)
- Axis of Symmetry: x = −1
- Increasing: (−∞, −1)
- Decreasing: (−1, ∞ )
- Maximum Value: (−1, −2)
- x-intercepts: None
- y-intercept: (0, −4)
Axis of Symmetry
Example #3 Axis of Symmetry
There is a formula for finding the axis of symmetry of a quadratic equation:
y = ax2 + bx + c, ![]()
Example: y = x2 + 4x + 1
Steps:
List a, b: a = ___blank b = ___blank
Answer: a = 1, b = 4
Plug into the formula: ![]() :
: ![]()
Simplify: x = ___blank
Answer: x = −2
The Vertex
Did you notice anything from the previous problems?
When the vertex is (−1, −4) the axis of symmetry is x = −1.
When the vertex is (3, −4) the axis of symmetry is x = 3.
When the verted os (−4, −4) the axis of symmetry is x = −4.
So if we have the axis of symmetry, we have one value of the vertex. All we need to do is evaluate the equation and we will have the other value.
Example #4 Vertex
Steps: Find the axis of symmetry
We found this in the previous problem: x = −2
Plug in the x value: y = ( ___blank )2 + 4( ___blank ) + 1
Answer: −2, −2
Simplify: y = ___blank − ___blank + 1 = ___blank
Answer: 4, 8, −3
The vertex is ( ___blank, ___blank )
Answer: −2, −3
The x and y Intercepts
It is easy to find or at least estimate the x and y intercepts when graphing. How does this connect algebraically?
Look at the graph of y = x2 + 5x + 6

Name the y intercept: y = ___blank
Answer: 6
Name the x intercepts: x = ___blank and x = ___blank
Answer: −3, −2
Notice the y intercept is c in the equation. If we move the −3 and the −2 to the left hand side we would have x + 3 = 0 and x + 2 = 0.
These are factors of:
y = x2 + 5x + 6
(x + 3)(x + 2) = 0
Example #5 the x and y Intercepts
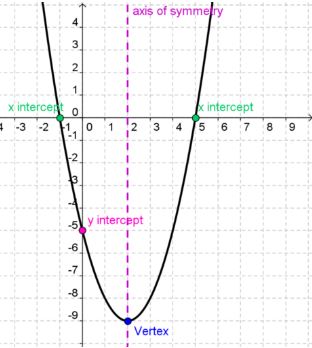
Using the equation y = x2 − 4x − 5, find find the y-intercept, x-intercept(s), axis of symmetry, and then graph.
In this equation, a = ___blank, b = ___blank, c = ___blank
Answer: 1, −4, −5
This means the y intercept is y = ___blank
Answer: −5
The x intercepts are found by factoring:
(x − 5)(x + 1) = y and solving x − 5 = 0 and x + 1 = 0 so the x intercepts are x = ___blank and x = ___blank.
Answer: 5, −1
The axis of symmetry: ![]()
Answer: −4/1
Simplify. The axis of symmetry is x = ___blank.
Answer: 2
Plug in x to get the rest of the vertex:
y = ( ___blank )2 −4( ___blank ) − 5 = ___blank
Answer: 2, 2, −9
Vertex is ( ___blank, ___blank )
Answer: 2, −9
Now let's graph.
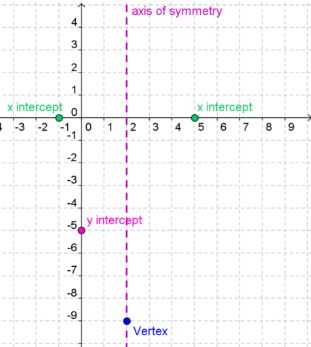
Because a = 1, so the graph opens up
The y intercept is y = −5.
The x intercepts are x = 5 and x = −1.
What was the axis of symmetry? x = 2
The axis of symmetry is graphed with a dashed vertical line.
Vertex is (2, −9).
Now complete the parabola.
Graphing Quadratic Equations
Example #6
Graph y = −2x2 + 3x + 5
Step 1: Find the axis of symmetry.
![]()
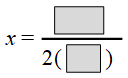
![]()
![]()
Axis of Symmetry : ![]()
Step 2: Find the vertex.
We know from Step 1 that ![]()
y = −2x2 + 3x + 5
Plug ![]() into the equation to solve for y.
into the equation to solve for y.
![]() Evaluate the exponents first.
Evaluate the exponents first.
![]() Evaluate the multiplication next
Evaluate the multiplication next
![]() Add by getting a common denominator
Add by getting a common denominator
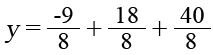
![]()
Vertex: ![]()
Step 3: Find the x-intercepts. Set y equal to 0 and solve.
0 = −2x2 + 3x + 5 To solve, factor the equation. Since a is negative, factor out the negative 1.
0 = −1(2x2 − 3x − 5)
Find the factors of a times c that add to equal b.
The factors of −10 that add to equal −3 are −5 and 2.
![]() Remember, to divide by a and reduce.
Remember, to divide by a and reduce.
![]() Since we are solving, we do not have to move the 2 to the front of the factor.
Since we are solving, we do not have to move the 2 to the front of the factor.
−1 ≠ 0 or ![]() = 0 or x + 1 = 0
= 0 or x + 1 = 0
x = ![]() ; x = −1
; x = −1
x-intercepts: ( ![]() , 0) and (−1, 0)
, 0) and (−1, 0)
Step 4: Find the y-intercept. The y-intercept is the c-value.
c = 5
The y-intercept is (0,5)
Graph y = −2x2 + 3x + 5
We will now graph everything that we have found.
Because a = −2, so the graph opens down
Axis of Symmetry : ![]()
Vertex: ![]()
x-intercepts: ( ![]() , 0) and (−1, 0)
, 0) and (−1, 0)
The y-intercept is (0,5)
Now, draw a quadratic curve connecting the points.
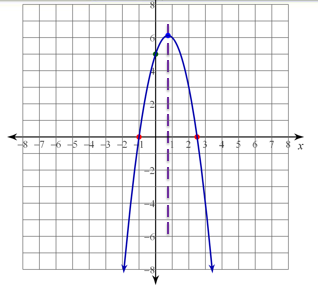
The axis of symmetry is graphed with a dashed vertical line.