Learn
Cows and Chickens
A farmer counted the number of cows and chickens by counting heads and legs. If he counted 35 heads and 78 legs, how many cows and how many chickens did he have?
In the introduction, you were given a problem to experiment with. If you were lucky you might find the answer right away, but as problems get more difficult, using trial and error could also be futile. Let's look more closely at this problem.
A farmer had 35 heads of cows and chickens on his farm. Barring any two-headed cows or chickens, this would tell us there are 35 animals total. That might be 1 and 34, 2 and 33, 3 and 32 and so on.
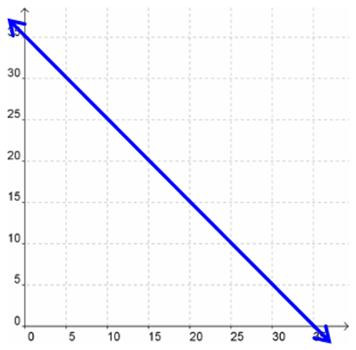
We could also create an equation for this: Let x = cows and y = chickens. Cows + Chickens = 35, so x + y = 35.
A good way to represent this would be to graph it. Plot the line, starting with the point (0, 35).
Answer:
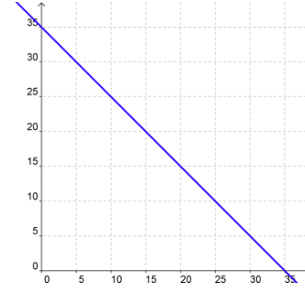
The farmer also had 78 legs on the cows and chickens. Cows have four legs and chickens have two legs. 4x + 2y = 78.
That might be 4(1 cow) and 2(37 chickens)4(1) + 2(37) = 4 + 74 = 78 , 4(2 cows) and 2(35 chickens)4(2) + 2(35) = 8 + 70 = 78 , 4(3 cows) and 2(33 chickens)4(3) + 2(33) = 12 + 66 = 78 , and so on. Plot the line above on the same graph.
Answer:
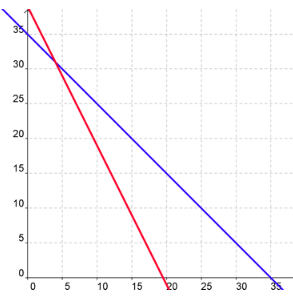
All points on the blue line will make the first equationx + y = 35 true and all points on the red line will make the second equation4x + 2y = 78 true, but the only answer that is a solution to the system is the point of intersection which is true for both equations. That point is (4, 31) which represents 4 cows and 31 chickens.
4 + 31 = 35 heads and
4(4) + 2(31) = 78 legs.
Example #1
Troy and his friends meet for breakfast at a local snack bar before school each morning. One morning Troy bought three biscuits and two drinks for $9.00. Jarrod spent $14.50 on five biscuits and three drinks. Create a system of equations to represent the problem and find the cost of the biscuits and the drinks by graphing.
Let's start by identifying the two variables. They are biscuits and drinks. Represent biscuits with the letter b and drinks with the letter d.
Let's start by looking at Troy's breakfast and finding an equation for it.
(Fill in the blank)____b + (Fill in the blank)____d = $ (Fill in the blank)____
Now, find an equation representing Jarrod's breakfast.
$ (Fill in the blank)____ = (Fill in the blank)____b + (Fill in the blank)____d
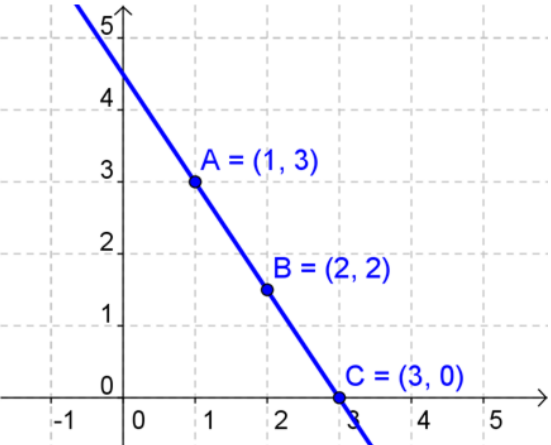
Let's start by graphing the equation for Troy's breakfast. Let b be the horizontal axis and d the vertical axis.
Substitute in 1, 2, and 3 for the value of b and find the value of d. Graph those points to create a line.
Answer:
Now graph the equation for Jarrod's breakfast. Let b be the horizontal axis and d the vertical axis.
Try using 0.50, 1.70, and 2.3 for the values of b.
Answer:
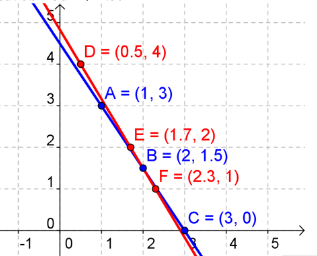
The solution is the intersection. Biscuits were $2.00 and drinks were $1.50.
Example #2
Sometimes a system can be used to represent inequalities. They are graphed just like equations but must be shaded to represent the area of solutions. Look at this system of inequalities:
- x + y > 8
- 2x + y ≤ 12
The steps given next are for graphing by hand to help with the next lesson. However, this is easily done in Geogebra and on a graphing calculator.
Watch Solve Systems of Two Inequalities.
Open Solve Systems of Two Inequalities in a new tab
Note: The presentation may take a moment to load.
Linear Programming
Linear Programming Definitions
In a linear programming situation, the function for which we are trying to find a maximum or minimum value is called the objective function.
The constraints in a linear programming problem form a system of inequalities. The graph of this system is called the feasible region. This region contains all of the ordered pairs that satisfy all of the constraints.
The feasible region is in the shape of a convex polygon. It has been proven that the maximum or minimum value of the objective function will always be found at a vertex of the feasible polygon region.
Example #3
Watch Determine Maximum or Minimum Value for an Objective Function Given the Graph of the Constraints and the Feasible Region.
Note: The presentation may take a moment to load.
Example #4
Watch Determine Maximum or Minimum Value for an Objective Function Given the Graph of the Constraints and the Feasible Region.
Note: The presentation may take a moment to load.
Graphing Constraints
Graph Constraints to Determine Max/Min Values
In the previous examples, we learned to determine maximum or minimum values for an objective function if we were given the graph of the constraints and the feasible region.
In this lesson, the objective function and the system of constraints will be given, and the graph will have to be constructed. Then, as before, the vertices of the feasible region will be used to determine the maximum or minimum value of the objective function.
Example #5
Watch Determine Maximum or Minimum Value for an Objective Function Given the Constraints.
Open Determine Maximum or Minimum Value for an Objective Function Given the Constraints in a new tab
Note: The presentation may take a moment to load.
Example #6
Watch Determine Maximum or Minimum Value for an Objective Function Given the Constraints.
Open Determine Maximum or Minimum Value for an Objective Function Given the Constraints in a new tab
Note: The presentation may take a moment to load.