Learn
Absolute Value Functions
An absolute value function is a function which involves finding the absolute value of a variable. The standard equation for an absolute value function is:
- y = |x|
- f(x) remember, this means the same thing as "y =" = |x|
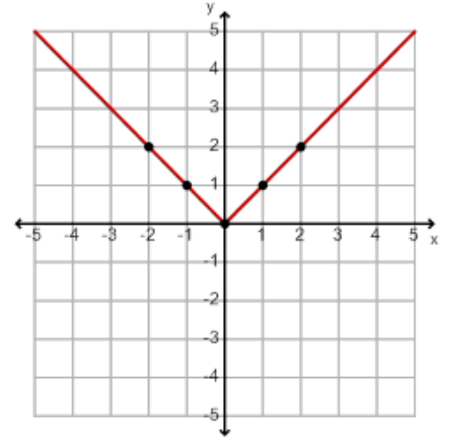
These equations represent the parent graph of an absolute value function. A parent graph serves as the basic shape or foundation from which all other variations of the function are derived.
Parent Graph
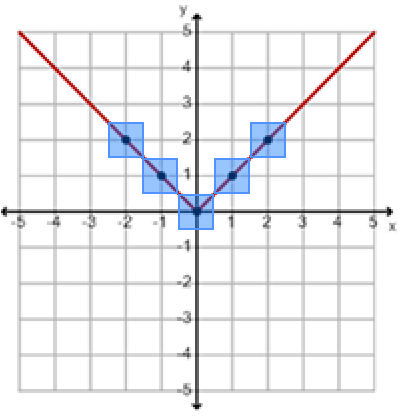
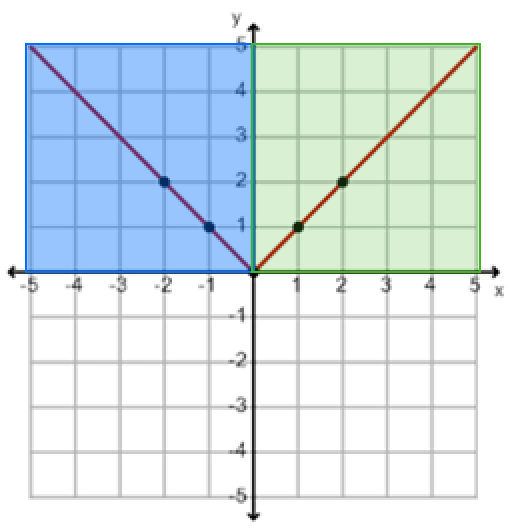
To graph this function, start by creating an x-y table. For each value of x that you choose, find the absolute value of x to determine the corresponding y-value. Then plot the ordered pairs on the coordinate plane.
| x | y | Ordered Pair |
|---|---|---|
| −2 | |−2| = 2 | (−2, 2) |
| −1 | |−1| = 1 | (−1, 1) |
| 0 | |0| = 0 | (0, 0) |
| 1 | |1| = 1 | (1, 1) |
| 2 | |2| = 2 | (2, 2) |
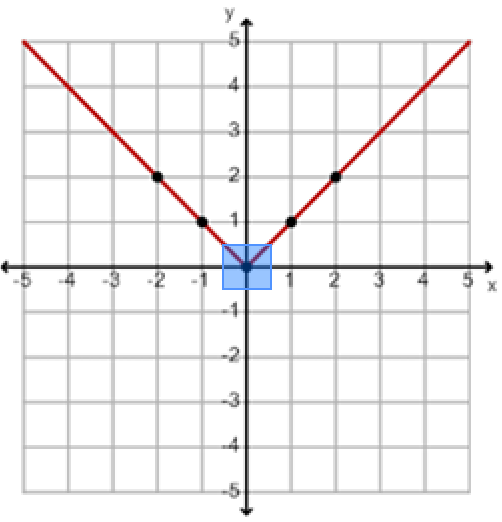
Vertex of the Graph
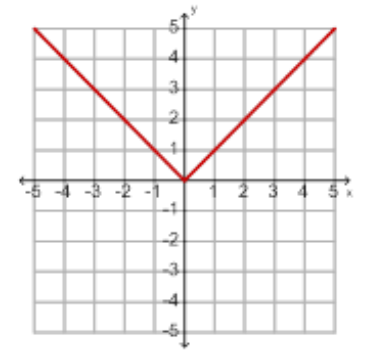
You will notice that the graph looks like a "V". The point of the "V" is the minimum value for the graph. The minimum value of a graph is the lowest point on the graph. This minimum value is also called the vertex of the graph.
The minimum value and vertex for the parent function is (0,0).
Absolute Value Function as a Piecewise Function
The absolute value function, y =|x| is a piecewise function. It consists of two parts: a line with a negative slope that extends from negative infinity to zero, and a line with a positive slope that extends from zero to positive infinity.
The absolute value function, y =|x| can be written as this piecewise function: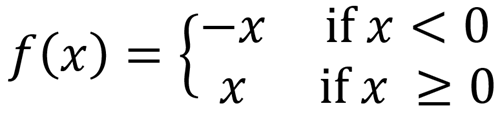
Example #1
Watch Graph Absolute Value Functions; Determine the Vertex and Describe the Translation of an Absolute Value Function.
Note: The presentation may take a moment to load.
Example #2
Watch Graph Absolute Value Functions; Determine the Vertex and Describe the Translation of an Absolute Value Function.
Note: The presentation may take a moment to load.
Example #3
Watch Graph Absolute Value Functions; Determine the Vertex and Describe the Translation of an Absolute Value Function.
Note: The presentation may take a moment to load.
Example #4
Watch Graph Absolute Value Functions; Determine the Vertex and Describe the Translation of an Absolute Value Function.
Note: The presentation may take a moment to load.
Vertex Form
Vertex Form of the Function
The translations you've learned about shift the graph up, down, left, or right. Sometimes you will see multiple translations in one equation.
The vertex form of the absolute value function is:
f (x) = a|x - h| + k
The vertex of graph is at (h, k). Note: The value of h is the opposite of what is in the absolute value!
The constant, k of the function determines whether the graph will translate up or down. The number inside the absolute value symbol, h determines whether the graph will translate left or right.
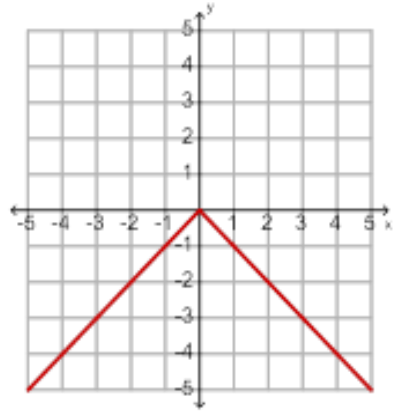
The sign of a determines whether the graph will open up or down.
If a is positive, the graph will open up. If a is negative the graph will open down.
Opening of the Graph
The leading coefficient The very first number or number in front of the absolute value symbol. The leading coefficent is represented by "a" in the formula. of the function determines whether the graph opens up or down.
f (x) = a|x - h| + k
If the leading coefficient is positive, the graph will open up and the vertex will be a minimum point.
If a>0 (positive), the graph will open up.
If your leading coefficient is negative, the graph will open down and your vertex will be a maximum point.
If a<0 (negative), the graph will open down.
Example #5
Watch Determine the Vertex of an Absolute Value Function and Whether the Graph of an Absolute Value Function and Whether the Graph of an Absolute Value Function Opens Up or Down.
Note: The presentation may take a moment to load.
Example #6
Watch Determine the Vertex of an Absolute Value Function and Whether the Graph of an Absolute Value Function and Whether the Graph of an Absolute Value Function Opens Up or Down.
Note: The presentation may take a moment to load.
Example #7
Watch Determine the Vertex of an Absolute Value Function and Whether the Vertex is a Maximum or Minimum Point; Describe the Translation.
Note: The presentation may take a moment to load.
Solving Graphically
We can now use our knowledge of graphing absolute value functions to solve absolute value equations. Let's see how this works!
Example #8
Watch Solve Absolute Value Equations by Graphing. ACCESS - Blank Grid will take you to GeoGebra.
Open Solve Absolute Value Equations by Graphing in a new tab
Note: The presentation may take a moment to load.
Example #9
Watch Solve Absolute Value Equations by Graphing. ACCESS - Blank Grid will take you to GeoGebra.
Open Solve Absolute Value Equations by Graphing in a new tab
Note: The presentation may take a moment to load.
Example #10
Watch Write and Graph Absolute Value Equations to Solve Real-World Problems.
Open Write and Graph Absolute Value Equations to Solve Real-World Problems in a new tab
Note: The presentation may take a moment to load.
Example #11
Watch Write and Graph Absolute Value Equations to Solve Real-World Problems.
Open Write and Graph Absolute Value Equations to Solve Real-World Problems in a new tab
Note: The presentation may take a moment to load.
Example #12
Watch Compare Properties of Two Functions Each Represented in a Different Way.
Open Compare Properties of Two Functions Each Represented in a Different Way in a new tab
Note: The presentation may take a moment to load.