Learn
What is a Step Function?
A step function is exactly as it sounds – a series of steps or stairs. This function is a piecewise function consisting of only horizontal lines, or constants.
Horizontal lines are written in the form y = k or f(x) = k where k is a constant. For example, y = 4 and f(x) = −2 are two examples of constant functions.
In the chart below you can see that the cost of shipping is dependent on the weight of the package.
| Cost | Weight (in lbs) |
|---|---|
| $7.50 | 0 < weight ≤ 5 |
| $12.00 | 5 < weight ≤ 10 |
| $20.50 | 10 < weight ≤ 20 |
You can easily graph this information as a function because it can be algebraically represented as the following function.

Graphical Representation
You can create a graphical representation using the information.
After you graph each piece of the graph, you will have something that looks like the graph below.
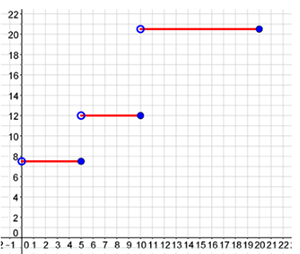
From this graph, you can see that it looks like a staircase. Which interval is the largest with regard to weight?
- 0 < x ≤ 5
- 5 < x ≤ 10
- 10 < x ≤ 20
On the graph, you notice there are several open points. These open points represent where you have only greater than instead of "or equal to" in your interval.
Example #1
Remember the word constraints? Some graphs that have contraints are called piece-wise graphs. They are "pieced" together. like the following example. The condition on these graphs is the domain beside each equation. The equation can only be graphed on the interval of the given domain.
Watch Graph Piecewise-Defined Functions.
Open Graph Piecewise-Defined Functions in a new tab
Note: The presentation may take a moment to load.
Example #2
Watch Graph Step Functions
Open Graph Step Functions in a new tab
Note: The presentation may take a moment to load.
Example #3
Watch Graph Step Functions
Open Graph Step Functions in a new tab
Note: The presentation may take a moment to load.
Do You Always Have a Line Segment?
Sometimes step functions include intervals that extend to infinity or negative infinity. This means the graph will have one or more rays as part of the graph.
Note: On some graphing calculators or apps, the arrows may not show on the screen, but know that the far left and far right parts of the graph extend indefinitely.
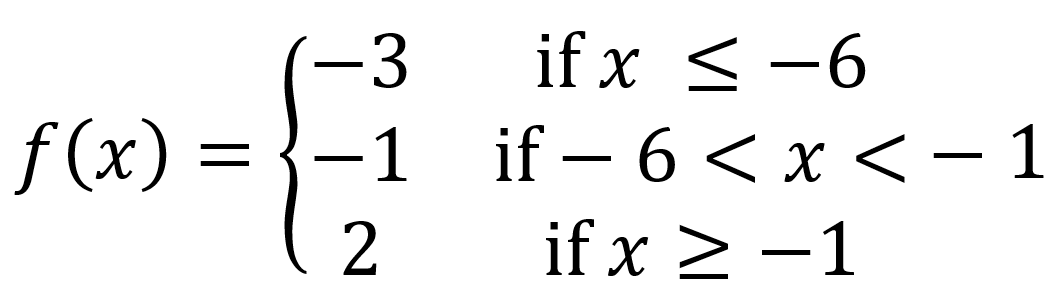
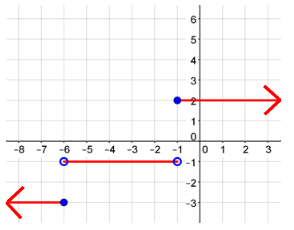
Example #4
Watch Graph Step Functuions
Open Graph Step Functions in a new tab
Note: The presentation may take a moment to load.