Try It
Graphing Linear Functions and Inequalities Practice Problems
Practice Problem #1
You're helping a friend with homework. He is trying to graph 2y - 4x = 8 using the x and y intercepts. Your friend shows you the following possibilities for the x-intercept. Which of them is the correct x-intercept?
- −2
- 1
- 2
- 4
Practice Problem #2
Which of the following coordinates could be a y-intercept? Hint: Three of the choices could never be a y-intercept.
- (0,2)
- (1,1)
- (4,-3)
- (-5,0)
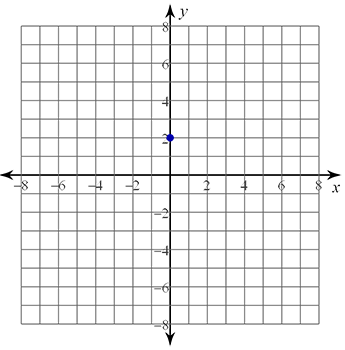
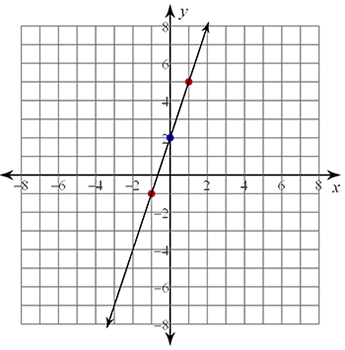
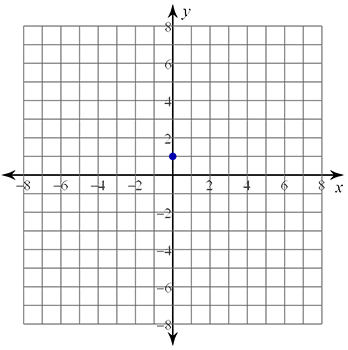
Practice Problem #3
Graph y = 3x + 2
First, identify the y-intercept.
The y-intercept is _____ (Fill in the blank).
Plot the y-intercept.
Next, identify the slope. Write it as a fraction.
The slope is _____ (Fill in the blank)
Use the slope to plot a point to the left and right of the y-intercept. Remember that slope is rise over run. Then draw a line through your points.
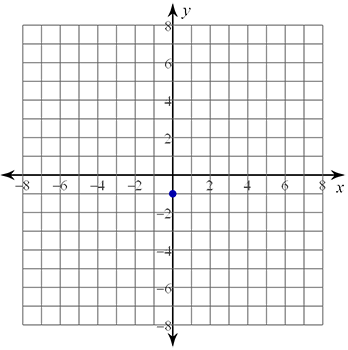
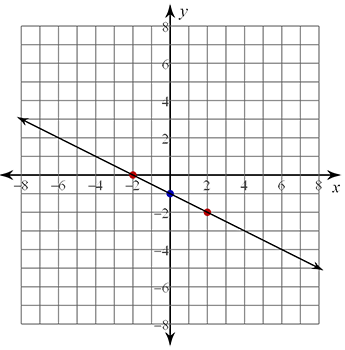
Practice Problem #4
Graph y =  x − 1.
First, identify the y-intercept.
The y-intercept is _____ (Fill in the blank).
Plot the y-intercept.
Next, identify the slope.
The slope is _____ (Fill in the blank)
Use the slope to plot a point to the left and right of the y-intercept. Remember that slope is rise over run. Then draw a line through your points.
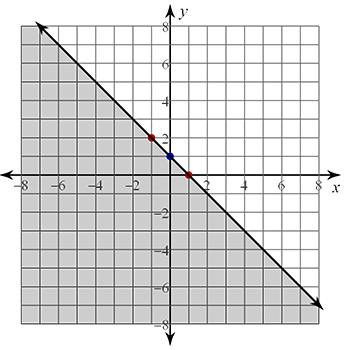
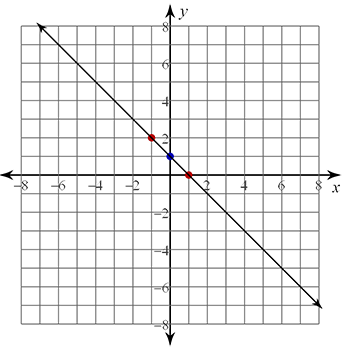
Practice Problem #5
Graph y ≤ −x + 1.
Will the line be dashed or solid?
Identify the y-intercept.
The y-intercept is _____ (Fill in the blank).
Plot the y-intercept.
Next, identify the slope. Write it as a fraction.
The slope is _____ (Fill in the blank)
Use the slope to plot a point to the left and right of the y-intercept. Remember that slope is rise over run. Draw a solid line through the points.
Next, choose a point to test for shading. We can test (0,0). Plug 0 in for x and y into the original equation.
y ≤ −x + 1
____ (Fill in the blank) ≤ −(____) (Fill in the blank) + 1
Simplify
0 ≤ ____ (Fill in the blank)
Is 0 less than or equal to 1? Yes
This means that the shading will be on the same side as the point (0,0).